What is Tableau?
Tableau is a business intelligence (BI) and data visualization tool that allows business users to perform complex data analysis independently, without requiring deep technical knowledge. It provides intuitive drag-and-drop functionality for creating dashboards, and offers various components that support everything from data preparation to browser-based and mobile analytics.
What are the main components of Tableau?
Tableau consists of two main components: Tableau Desktop and Tableau Server or Tableau Online. Tableau Desktop is used for creating dashboards and preparing data for analysis, while Tableau Server and Tableau Online allow you to share and access dashboards across the organization.
What is Tableau Prep Builder?
Tableau Prep Builder is a complementary tool for preparing data before it is analyzed in Tableau Desktop. It allows users to create data preparation workflows, which can be visualized as flow diagrams. The workflows apply changes to the entire dataset and can be saved or written back to a database.
How does Tableau support self-service analytics?
Tableau enables business users to create dashboards and reports without needing advanced IT skills. The intuitive drag-and-drop interface allows users to build visualizations quickly, while interactive elements help in exploring data dynamically. Users can easily filter and analyze data, facilitating self-service analytics across the organization.
What types of charts can be created in Tableau?
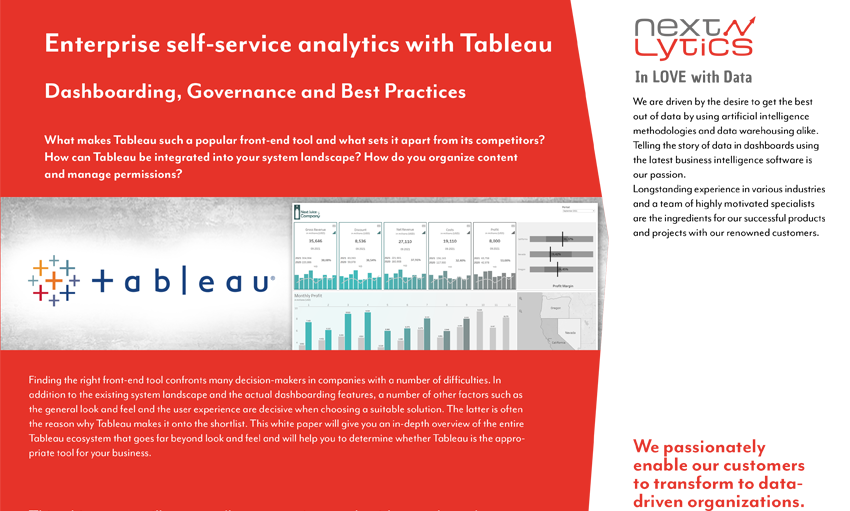
Tableau provides a wide variety of chart types, including bar charts, line charts, waterfall charts, bubble charts, heat maps, tree maps, and geo maps. It also allows for custom visualizations based on the data, which can be tailored to meet specific business needs.
How does Tableau handle data connectivity?
Tableau offers more than 40 connectors for various data sources, including relational and multidimensional data sources like SAP BW, as well as cloud applications such as Salesforce and Google Analytics. Data can be connected live or through data extracts, and updates can be scheduled for data extracts as needed.
What is the benefit of interactive elements in Tableau dashboards?
Tableau allows users to create interactive dashboards, where they can click on data points to filter or highlight information. Parameters can also be changed interactively, and these actions are reflected in dynamic calculations, helping users explore and understand data in more depth.
What is the difference between Tableau Server and Tableau Online?
Tableau Server is an on-premise solution that can be installed on public cloud infrastructure or local servers, offering more control over data security and management. Tableau Online is a cloud-based version of Tableau Server, hosted by Tableau, with no need for infrastructure management. Both platforms allow users to share, explore, and collaborate on dashboards.
How does Tableau support advanced analytics?
Tableau enables advanced analytics by allowing integration with Python, R, and MATLAB for in-depth statistical analysis. It supports time series analysis and forecasting directly in Tableau, providing data experts with the flexibility to configure models while presenting the results in an easy-to-understand visual format.
What is the licensing model for Tableau?
Tableau offers two main licensing models: role-based and core-based. In the role-based model, each user is licensed and assigned a role, while the core-based model defines how many computer cores Tableau Server can run on. Core-based licenses offer more flexibility with users, but performance may degrade with increasing user numbers. Creator licenses are required for users creating or editing dashboards.
How does Tableau handle security and data access?
Tableau offers row-level security to ensure that users can only see the data they are authorized to view. This is implemented using user filters or dynamic filters, which match user-to-field assignments. Tableau's version 2021.4 centralizes the management of row-level security, ensuring consistency across datasets and workbooks.
Can Tableau dashboards be customized with web applications?
Yes, Tableau offers an extension framework, allowing dashboards to be embedded in web applications via the JavaScript API. Additionally, the Extension API enables the addition of custom functionalities to Tableau dashboards, enabling interaction with data from other applications.
What are the key advantages and disadvantages of Tableau?
Advantages:
- Intuitive drag-and-drop dashboarding.
- Easy data cleansing and preparation features.
- Flexibility to scale with company growth.
- Numerous native connectors to various data sources.
Disadvantages:
- Relatively expensive compared to other tools like Power BI.
- Does not support importing custom charts.
- Functionality is not yet fully consolidated in a single platform.
/Logo%202023%20final%20dunkelgrau.png?width=221&height=97&name=Logo%202023%20final%20dunkelgrau.png)