Download Whitepaper
Dashboarding with SAP Analytics Cloud (SAC)
Learn more about the different components, use cases and best practices.
Shaping Business Intelligence
About us
Our Methodology
Data Science & Engineering
SAP Planning
Business Intelligence
Every employee's daily decisions have a direct impact on your company. A good and meaningful dashboard is essential to make it much easier for all employees to understand KPIs and their impact on specific processes. The advantages are obvious:
As a decision maker, you should always get the right answers to your questions from your dashboard. As a competent partner for dashboarding, we can help you do just that. Our experts for design and user experience, front-end development, business processes and data provision are available for every project. Experience has shown that projects with individual specialists are much more efficient and the result is all the better. That is why we always put together the optimal team of individual experts to achieve the best possible result for you.

Properly planned and executed, you will get the most out of your dashboard in the future and our joint project will be a success. The following project model has proven itself for our customers:
First of all, we record your requirements for your new dashboard and create a planning sheet together with you in order to avoid potential errors right from the start. Then, the most important question for your new dashboard is: Which key factors are most important to you and should never be missing? The KPI Score Sheet provides you with the information you need and forms the basis for our project. In addition, we clarify for which target group the dashboard should be created: Would you like an application-oriented dashboard with a focus on special logic and optics? Or do you want it to be a self-service dashboard? Once the planning is complete, our web design and user experience specialists will set up an initial prototype for you.

After acceptance of the prototype, the technical implementation takes place. We will assist you in choosing the right dashboarding tool. The focus is entirely on the desired requirements and technical conditions.
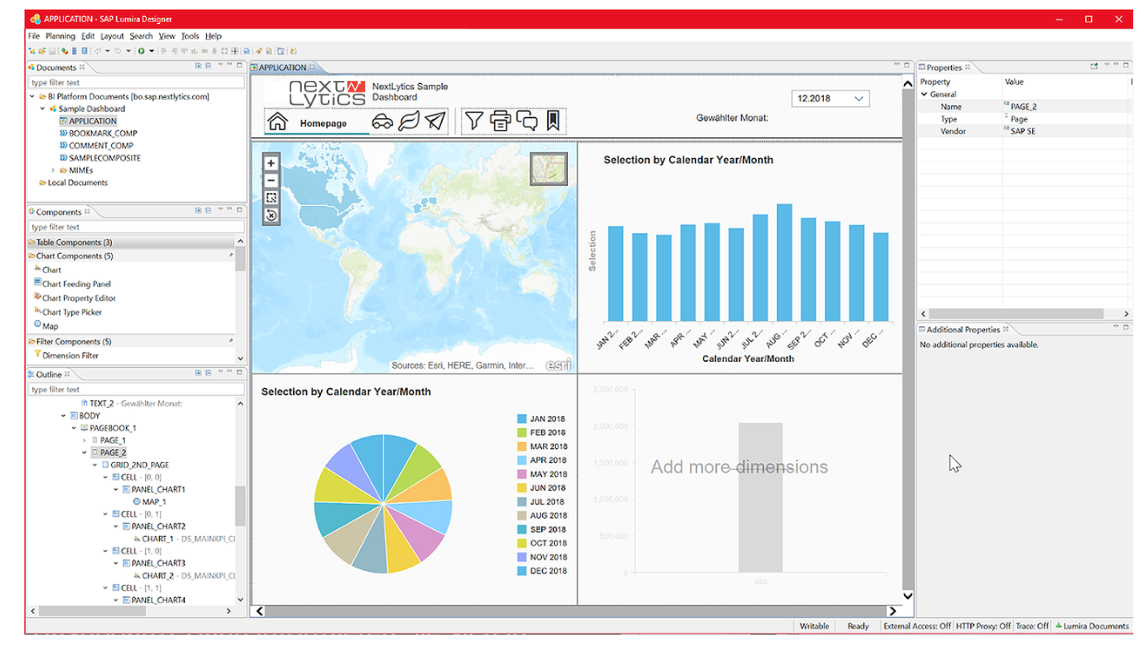
If the corresponding technical infrastructure for Lumira Designer already exists and special requirements (e.g. special logics, corporate designs) are to be implemented, Lumira Designer is the preferred solution.
If dashboards are to be further developed by the department and business users, the introduction of a self-service tool like SAC Stories, Tableau, Power BI or others is worthwhile. If enterprise dashboards or dashboards with special requirements are needed, you will rather need a tool like SAC Analytic Applications, SAP Lumira or with some restrictions Tableau. Each tool has its own strengths and weaknesses.
Once the appropriate dashboarding tool has been selected, the data modeling and query creation process continues. In the penultimate project phase, usability is optimized and possible bugs are eliminated. At the end of our project comes the testing phase by the customer, in which last discrepancies are eliminated.
Our project management methodology, which is tailored to dashboard development, ensures that your dashboard is implemented on time and within budget. Our projects are usually completed after 90 days.
We have many years of profound experience in data modeling in all essential business processes (SAP SD, FI/CO, Procurement, HCM, etc.) and can also talk to you on a technical level.

The times in which the design already participates in some "incidental" thing are definitely over. The demands in the age of digitalization have increased and intuitive user experience is a key element of a dashboard.
The frontend implementation can take place in Tableau, SAP Analytics Cloud or SAP Lumira, for example. We already have many years of experience in implementing dashboards and can also implement more complex developments.
Implementation with Self-Service-Tools:
Implementation with more complex (coded) dashboards:
The special feature of these solutions is the script development in BI Action Language (BIAL). In addition, customer-specific components can be developed if desired functions are missing.

These are some of the most frequently asked questions about Dashboarding.
Dashboards are crucial for supporting daily decision-making by providing a clear and interactive representation of KPIs. They allow users to quickly access real-time data and understand the impact on various business processes, leading to more informed and faster decisions.
Dashboards facilitate collaboration between departments like sales, marketing, production, and IT by providing a central hub for joint planning and decision-making processes. They enable transparent and efficient communication through integrated comments, tasks, and a calendar for milestones and workflows.
The process begins with gathering your requirements and creating a planning guide to avoid potential errors. A KPI Score Sheet is developed to define the key factors. After planning, an initial prototype is created, tested by users, and then moved into the technical implementation phase.
The right choice depends on your specific requirements and technical environment. SAP Analytics Cloud provides a wide range of capabilities – from advanced use cases to simple, accessible self-service. Other tools such as Power BI or Tableau are particularly strong when it comes to enabling business departments to independently build and extend dashboards.
Dashboards can be built with a variety of tools, such as SAP Analytics Cloud (SAC), Power BI, Tableau, and others. Within the SAP landscape, however, SAC and Power BI have emerged as the most commonly used solutions in recent years.
User interface design plays a key role. Dashboards must be intuitive and user-friendly to allow easy and efficient interaction. Modern design principles and the integration of interactive features help ensure that dashboards are both functional and visually appealing.
Data extraction and modeling are crucial in creating dashboards. They ensure that the right data sources are used and correctly linked to provide accurate and comprehensive planning and analysis.
Self-service dashboards allow users to input and analyze data independently, without needing IT department support. These dashboards are easy to use and offer flexible customization of planning and analysis functions.
Commenting features allow users to share insights, question data, or explain reasons for certain planning decisions directly within the dashboard. This promotes collaboration and helps clarify data and its implications on decisions.
Our business world increasingly resembles a balancing act. On the one hand, dynamic markets and...
The Q3 2025 update for SAP Analytics Cloud (SAC) brings a wealth of new features and improvements....
In today's fast-paced business world, agile and accurate financial planning is critical to a...
» Sep 19, 2025 German SAP User Group Conference 2025 in Bremen - The Art of Balance
» Aug 22, 2025 How has SAP Analytics Cloud QRC3 2025 Evolved as a Dashboarding Tool?
» Jul 14, 2025 SAC FP&A: Your quick start into agile financial planning
» Jul 1, 2025 SAP Analytics Cloud Migration: Benefits, Timeline & Challenges
» Jun 26, 2025 VBA in the SAP Analytics Cloud Excel add-in – we have tested it
+