/Logo%202023%20final%20dunkelgrau.png?width=221&height=97&name=Logo%202023%20final%20dunkelgrau.png)


After the vacation season everybody is slowly returning to their desks being in a good mood and having their sun tanks filled up. Perfect time to implement a few improvements in current and future dashboard projects. Out of our multi-year BI-Project-Experience we wrote down a few tips on how the next dashboard project succeeds while nobody falls short.
Because often, Dashboards replace older, but very loved by the business, solutions. We immediately think of incredibly giant Excel-Workbooks - you too?
Then here are tips for BI-Projects, with which the business does not fall short.
1. Workshops, Workshops, Workshops
 At any point of a project, we recommend holding workshops - ideally regularly in the form of a weekly meeting with the project team and a monthly workshop including all stakeholders.
A dashboard project is no pure IT effort. The many stakeholders within the business have to be willing to block time and to think the dashboard through together with IT as well. Especially that can turn out to be tricky as the business might hold tightly onto existing solutions and might not plan enough time to test implemented features.
In order for the collaboration to work despite that, we create mock-ups (e.g. in PowerPoint), prototypes (in SAC, Tableau or Power BI), or early test versions in every stage of a project. That provides a common base when discussing changes and improvements.
Ideally, these mock-ups are modified live in the workshops, the result of the workshop then being the modified version of the mock-up.
This ensures everybody is up to speed on the current state of the project and helps IT staff to implement exactly what was discussed. Misunderstandings and fears can be eradicated in early stages of a project and helps to actively involve stakeholders on design and scope questions.
2. The first look is crucial (literally)
 Dashboards should, according to our design philosophy, show at first glance, if the business is going well or badly. Only in the following analysis and pages the question should be answered, why the business is going well or badly.
That’s why in early workshops key figures or KPIs (Key Performance Indicators) should be identified. These can be subject to a specific stakeholder, so you might end up with multiple. Here we have to differentiate between a strategic and an operative dashboard. These dashboard types speak to different audiences (Management vs. steering daily tasks) and instead of trying to implement one dashboard that satisfies all audiences, it is often sensible to create separate dashboards that both follow a dedicated story.
This difference should be clarified within the workshops as well. Oftentimes the result is supposed to be a strategic dashboard, which sneakily evolves into an operative dashboard as the project progresses. That might happen, when the management wasn’t included well enough into the workshops that were being held.
For that reason it is important to ask the management, according to which KPIs they determine how their business is doing. These KPIs should be presented on the starting page of the dashboard.
SAP Analytics Cloud vs Lumira Designer -
The ultimate comparison!
3. Abstract detailed layers
Now that the management sees at first glance, if the business is running well or badly, the following pages in the dashboard have to answer, where and why the business is running well or badly. The “where” is important for the management, so they know who to contact for further detailed queries. The “why” is important, so that single employees can comprehend how the figures are added up and in which areas they might have to improve.
Example:
In a strategic sales dashboard, a manager sees on highest level, that sales are up by 12% in the YTD-comparison (Year-To-Date). In the next step, the management would look at the departments in which the sales were up by so much that they compensated for other departments that weren’t doing so well. Now the management knows which departments to praise. Individual employees within those departments can now look into why their sales were up that high. Might it be multiple well-running products or maybe a few customers that are buying a whole lot more products this year?
All of these questions should be answered by a good strategic dashboard, meaning a lot of stakeholders have to be involved.
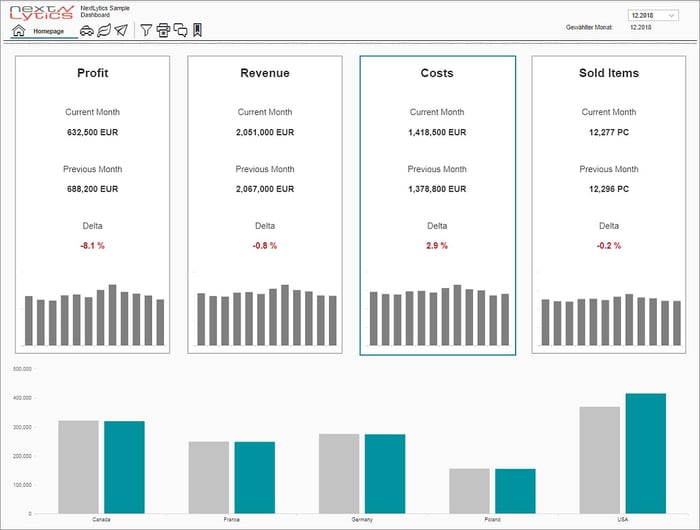
Taking the visual perspective, our approach most of the time is to present KPIs in tiles on the starting page, including comparisons to the previous year. Maybe there is room for a time series.
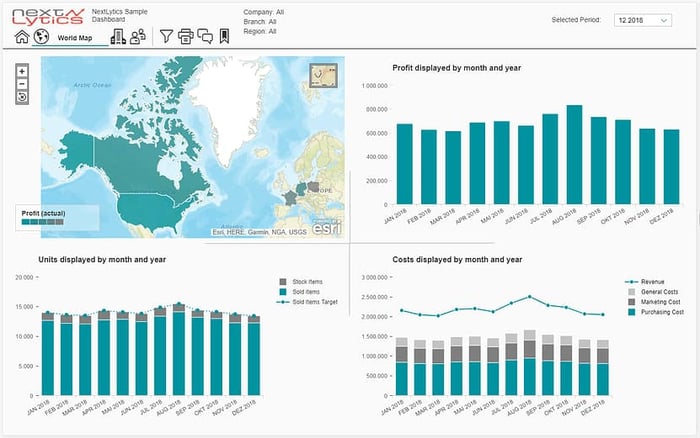
On the first subpage we implement detailed charts that show the KPIs e.g. by organizational unit, product or location.
If also non-management staff is within the audience for the dashboard, we display crosstabs on a second subpage, that show the data on a granular level, e.g. on material-, product, or customer-number.
4. Generous Go-Live-Stage

Because of the high complexity with many stakeholders, the go-live-stage should be planned with enough time in mind. A testing phase with a small test group should be done before go-live as well. Again, regular meetings to collect feedback are crucial, so feedback is not getting lost during the stressful go-live-stage.
When the dashboard is ready, multiple trainings should be held for different target groups. Sound like a lot of work? It is! But that’s the only way to ensure that every target group will use the dashboard after the go-live, which is essential for the success of the project.
By holding separate trainings, examples and presentations can be adjusted purposefully to the audience. The management can be shown how they answer the “if” and “where” regarding their business running well or badly.
Individual employees that are mostly operative staff can be shown how they find out why their business is going well or badly.
5. Specify next version even before go-live

During the test phase and probably even before that, there will come up requests for features and display of data within the workshops that cannot be implemented before go-live. According to the agile approach you should block time for these requests for future versions and communicate that transparently to the stakeholders. That ensures nobody has the feeling that feedback is lost or not taken seriously. That’s why you should even try to set a go-live date for the next version and maybe the ones following that. This strengthens the trust of the stakeholders in the new solution.
Even by holding many workshops, it can never be prevented, that stakeholders that use the tool within the testing phase and after the go-live, get a new perspective on the tool and will thus gain ideas for changes. Don’t turn those down, instead plan a small follow-up project right from the beginning of the initial project, to be able to meet those requests. Also after the follow-up long-term resources should be planned to refresh the dashboards, because reporting needs can change over years. When changing the data source to meet new requirements from the business, it can also be necessary to update the dashboards. Always think of that from the beginning when setting up a project to change data models.
These tips hopefully will help you to set up your next dashboard project more successfully.
Would you like to profit from our multiple-year BI-Project-Experience as well? Are you trying to build up the necessary know-how in your department or do you need support with a specific issue? Please don’t hesitate to contact us.