/Logo%202023%20final%20dunkelgrau.png?width=221&height=97&name=Logo%202023%20final%20dunkelgrau.png)


In this blog article, we will explore how SAP Analytics Cloud can help us make more informed decisions, by using its augmented analytics features, so called “Smart Features”. Furthermore, inside the scope of the article, is to explore the current limitations of those features.
To begin with, SAP Analytics Cloud (SAC for short) is a cloud-based analytics processing tool developed by SAP, that helps businesses analyze data and make informed decisions.
On the other hand, augmented analytics refers to the use of artificial intelligence (AI) and machine learning (ML) technologies to automate and enhance data analysis and insights generation. SAC's smart features leverage augmented analytics to enhance data analysis by automating insights, patterns, and correlations, simplifying the decision-making processes.
For this specific case, we are going to go through a sample dataset with procurement data that contains purchase orders, and see how we can utilize SAC’s smart features to easily produce insights that can help us make decisions faster.
Let’s go step by step and see how we can utilize these features in our own example.
Step 1: Import Data
First of, before we even begin utilizing the aforementioned features, we need to load our data to SAP Analytics Cloud. For this specific example, we will start by importing our procurement data into SAC from an Excel file. Once the data are imported, they are securely housed within the platform. Our dataset seems as follows:
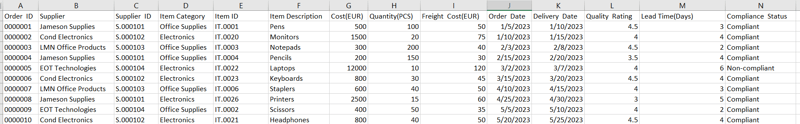
Procurement data
The import of the data can be done by selecting the "Datasets" icon on the left side menu. By navigating to the "Import from CSV/file" option, we can upload our file as a model.
Step 2: Quick Data Overview
There is a possibility to quickly explore certain aspects of the dataset, by using the “Search to Insight” feature. This is a smart feature of SAC, that allows you to very quickly explore the data by asking questions on a dataset. For example, you can ask it “ Show Total Cost by Supplier” and it can automatically create a chart for you, showing you a “Total Cost” per “Supplier” bar chart.
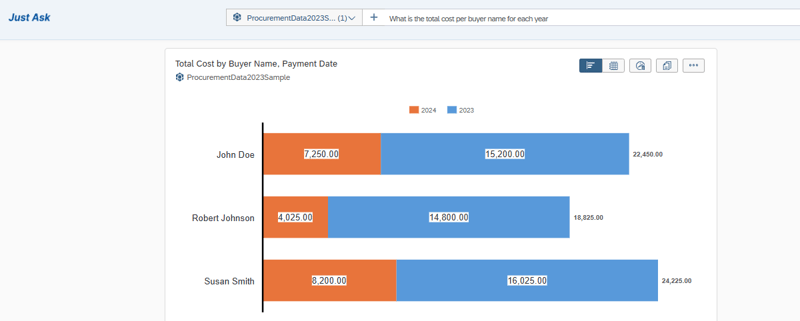
Recently, in the Q1 of 2024, SAC team released the “Just Ask” feature in its augmented analytics portfolio of features. “Just Ask”, is the next version of “Search to Insight” and it is a new natural language query feature powered by AI. It supports SAP Analytics Cloud acquired data models and SAP Datasphere models.
In contrast to its predecessor, “Just Ask” can understand more complex formulated questions. For example, you can ask it “What is the total cost per buyer name for each year” and it can automatically create a chart for you, showing you a “Total Cost” per “Buyer Name” bar chart with stacked bars for years 2023 and 2024 for comparison.
The best thing is that sometimes it can identify columns in the dataset without explicitly stating them in the question. If you ask for example “what is the total cost per buyer name for January only”, the model automatically extracts the month from the payment date field and filters the result accordingly.
“Just Ask” and “Search to Insight” are accessed directly from the SAP Analytics Cloud home page using the search bar and from the light bulb icon in the main toolbar.
Step 3: Explore Data
By navigating to "Stories" and selecting "Smart Discovery", we can begin using the augmented analytics features to automatically create a dashboard based on the target column we want to analyze.
Let us analyze the “Total Cost” column for this example and let’s see the impact that the “Buyer” has in it.
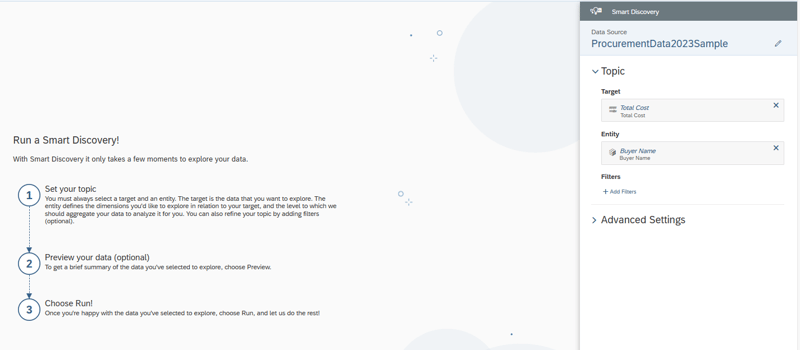
By selecting “Run”, SAC creates a dashboard based on the data provided by using ML/AI features. This dashboard seems as follows:
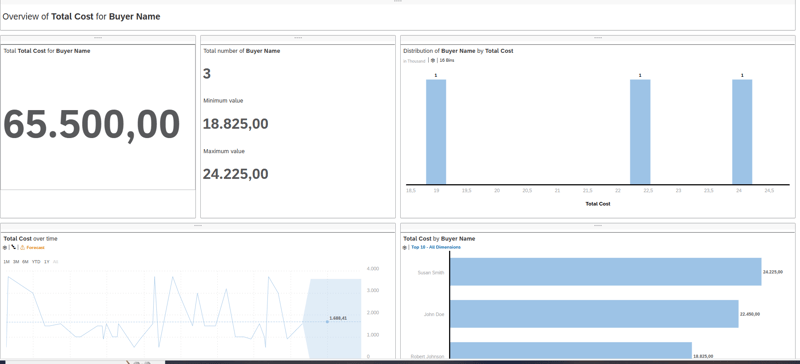
Dashboarding with SAP Analytics Cloud -
Download the whitepaper here!

Step 4: Unlock Patterns and Insights
SAC's “Smart Insights” can identify patterns and correlations within your data. By selecting the bottom right chart, we can view some interesting insights it has provided in a text format. We can expand those insights by clicking “View More” where we can see further interesting insights.
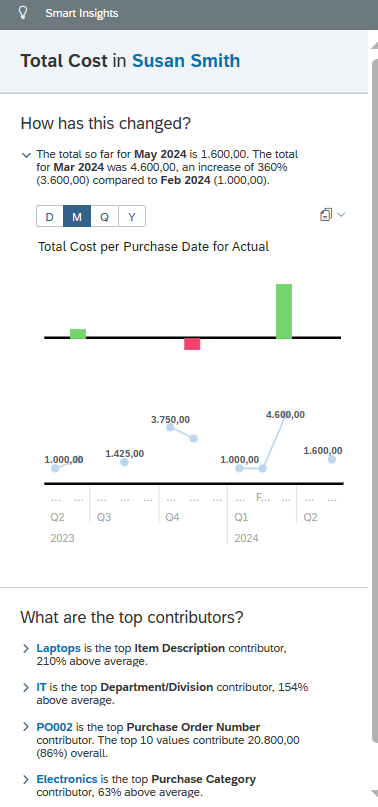
This is a feature that can quickly give you an overview of basic patterns found in a chart, like top contributors or change of values between a timeframe.
Limitations
In this article, we used a sample dataset of procurement data, in order to use it to explore the augmented analytics features of SAC. However, these features do come with some limitations.
The first feature , “Search to Insight”, is very useful when it comes to quickly creating charts and viewing certain aspects of the dataset. However there are some limitations to using it. In order to use “Search for Insight”, the data model must have certain prerequisites checked:
- Only models that do not have “Model Privacy” enabled, or any dimensions that do not have “Data Access control” activated based on acquired data, live SAP HANA, live SAP S/4HANA, live SAP Universe, and live SAP BW data are supported .
- Account dimensions that have multiple hierarchies are not supported.
- Specific keywords, formats and syntax are supported (e.g Show X by Y, Show X for all Y etc.)
- The interface can only identify and work with words in English.
- You have the required rights to access the model.
- The “Search to Insight indexing” option, under Model Preferences for the target model, is enabled.
Regarding the “Smart Discovery” and “Smart Insights” features, they are very useful in providing very good insights that are hidden within a dataset. Their limitation, however, is that the charts and insights that are being provided, are quite fixed (e.g Distribution charts, min-max values, bar charts, top contributors etc.) and can only provide specific insights about a dataset, not a deeper, more complex analysis.
As for the new “Just Ask” feature, it is certainly clear that it is much better than its predecessor “Search to Insight” when it comes to asking questions that contain more complex syntax and parameters. It also provides the user with more than one visualizations when more complex questions are being asked, in order to provide more information for a much better understanding of the data. As a natural language query though, there are times where the feature does not return the expected results for the user, as the syntax of the question needs to be specific and clear.
Augmented Analytics and AI
As for the future steps, SAC roadmap promises updates in the Augmented Analytics sector, as features are coming up in every quarter of the 2024 season. SAC is taking some steps in predictive planning in Q2, as well as planning integration with SAP Datasphere in Q3. Finally, at the end of this year, SAC is planning to release generative AI capabilities that allow users to analyze data, plan and simulate, as well as create and refine stories.
The dedicated AI assistant is called “Joule” and utilizes natural language. Joule was introduced in September 2023 and already had a debut in SAP S/4HANA Cloud. It is an advanced generative AI copilot, directly embedded into the applications of the SAP cloud enterprise portfolio.
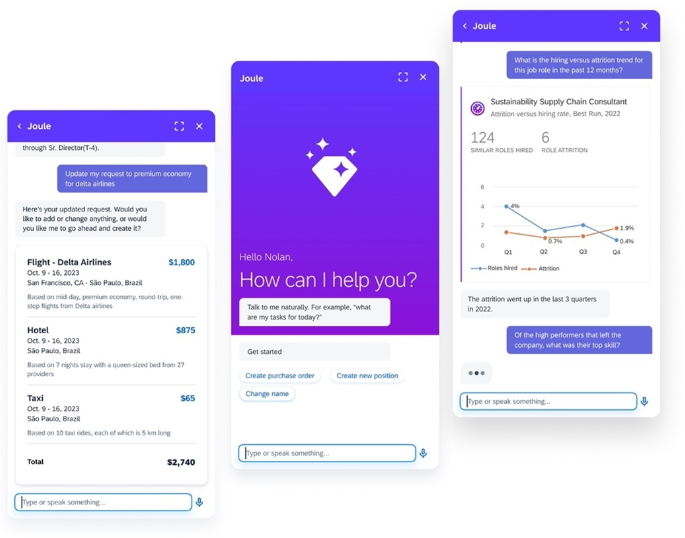
With Joule, users may simply ask a question or frame a problem in plain language and receive intelligent answers drawn from the business data across the SAP portfolio and third-party sources, retaining context. Joule will be integrated in multiple SAP products through the year and should be introduced to SAC late 2024.
Augmented Analytics in SAC - Our Conclusion
In conclusion, SAP Analytics Cloud provides very useful features that can be used to provide insights to make informed decisions. While it excels in providing insights from structured data with specific column names etc., it may struggle with providing more creative charts and insights and creating complex machine learning models on its own in order to fit the needs of many business inquiries.
The biggest downside of all the smart features is that they are mostly restricted to SAC models. Some will still work with live connections, but only with special requisitions like a tunnel connection or limited features. For customers that are working with acquired data or build their data models from scratch in SAC these features are a nice and helpful addition.
While SAP has done a better job on asking real life questions on the data with adding “Just Ask”, we still expect a better future on the augmented reality domain, with new features coming up that we are thrilled to explore.
Do you have questions about SAP Analytics Cloud or other topics? Are you trying to build up the necessary know-how in your department or do you need support with a specific issue? Simply contact us - we look forward to exchanging ideas with you!