Apache Airflow is the leading open source workflow orchestration platform and drives day-to-day digital business all over the world. If your organization uses Airflow, the volume of daily log and metadata quickly becomes an issue. Purging the Airflow metadata database and logs is a common routine to minimize storage costs. But you still want to show long-term statistics of your operations: How many workflows (“DAGs” in Airflow terms, for directed acyclic graphs) is your system running per month, quarter, or year? How often do certain DAGs fail in production? How long before operations can be recovered?
To combine these two opposing interests, we propose the combination of archiving specific Airflow DAG run metadata to a dedicated archive database and using the open source business intelligence toolkit Apache Superset to create long-term monitoring dashboards.
This article consists of two parts: First, we will introduce our approach to archive useful data from these Airflow database tables and subsequently, we will create Superset charts and dashboards based on these tables.
Open Source Dashboards with Apache Superset
Apache Superset is a staple when it comes to data visualization, with a plethora of charts available out-of-the-box and the ability to create sophisticated dashboards, tailored to everyone's needs. An interesting use case of Superset is the monitoring and visualization of logs and metadata generated from Apache Airflow ETL pipeline runs. DAG run fail rates, execution times and aggregations by operator type are only a handful of statistics that can be calculated and visualized through Superset, which data engineering teams may find useful for drawing conclusions about the state of their infrastructure.
Archiving Airflow DAG Run Metadata Airflow
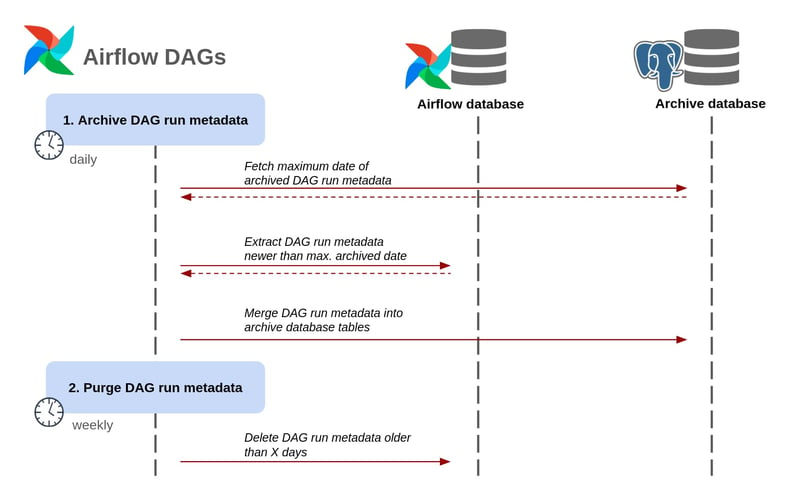
Every Airflow system uses an operational database that retains information about the inner workings of the system. Two of the most important tables are “dag_run” and “task_instance” which contain details regarding the execution of DAGs and the individual tasks thereof. These details include start and finish timestamps, states of the DAGs, information about the different operators used for each task, the corresponding configuration, and more. The information found in these tables is more than enough in order to construct informative plots and diagrams with Apache Superset. Since the volume of data collected grows quickly when Airflow is running many DAGs on frequent schedules, purging older information to minimize storage consumption is a common maintenance routine.
To save long-term statistics, we implement a simple archiving DAG that collects the records from the “dag_run” and “task_instance” tables which are available in every Airflow database, and stores them into a dedicated archive database. With each DAG run, only the most recent entries are selected for insertion, avoiding any duplicates.
Superset Charts & Dashboards
Apache Superset enables us to create plots and charts, and organize them into dashboards. Each chart depends on a dataset or an SQL query that is in turn, connected to a data source. Superset offers an abundance of connectors out-of-the-box for every major DBMS, although it is possible to connect to any data source via SQLAlchemy URIs. The first step is to connect the database that contains the “dag_run” and “task_instance” tables (extracted with the Airflow DAG) with Superset.
.jpg?width=500&height=838&name=Screenshot%202023-06-26%20at%2011-57-51%20Superset%20(1).jpg)
We provide the credentials and the connection is established. Superset uses the notion of “datasets” as sources for its charts. There are multiple options to create a dataset. We can specify a database table as a dataset from the source we just connected to through the UI. Another approach is to write an SQL query accessing the source and save the results as a dataset. While the former is easier to use, the latter gives more flexibility and allows for more complex data aggregations, like joining multiple tables. Basically, every valid "SELECT" query can be used as a dataset. To this end, we define a query through SQL Lab that calculates the execution time of each DAG.
.jpg?width=800&height=343&name=Screenshot%202023-06-26%20at%2012-31-38%20Superset%20(2).jpg)
Other necessary SQL queries may be defined in a similar fashion. Now we can start creating charts based on the datasets and queries just defined. Some of the most interesting are (but not limited to):
- DAG run states.
- Number of task operators.
- DAG execution time (distribution & averages).
- Task execution time (distribution & averages).
Effective workflow management with Apache Airflow 2.0
DAG run states
This chart is pretty straightforward to create, due to the “dag_run” table including a “state” column, so no additional calculations are needed.
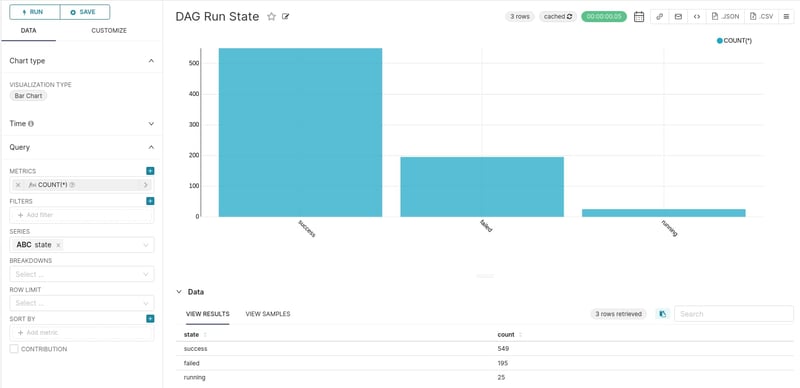
This is a simple barplot, counting the occurrences of each possible state a DAG can be in. It is essentially equivalent to executing “SELECT state, COUNT(*) from dag_run GROUP BY state;”. This query counts the occurrences of every possible state (“success”, “failed” and “running”). Most of the DAGs execute successfully and a handful of DAGs are currently still running.
Number of task operators
A similar chart is the one that counts the total number of each task operator.
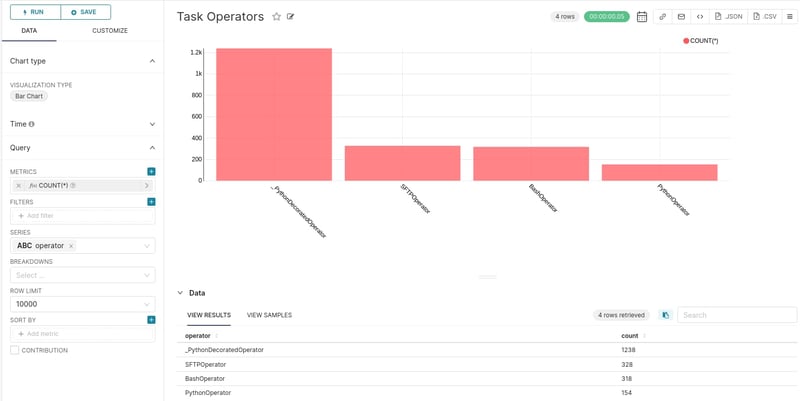
Again, this is equivalent to executing “SELECT operator, COUNT(*) FROM task_instance GROUP BY operator;”. Same as above, this query counts the occurrences of task operators. A large portion of the operators consist of Python decorator operators due to heavy use of the TaskFlow API.
DAG execution time
A useful metric to visualize is the distribution of DAGs execution time. To this end, we will use the results of the SQL query we defined earlier (image x).
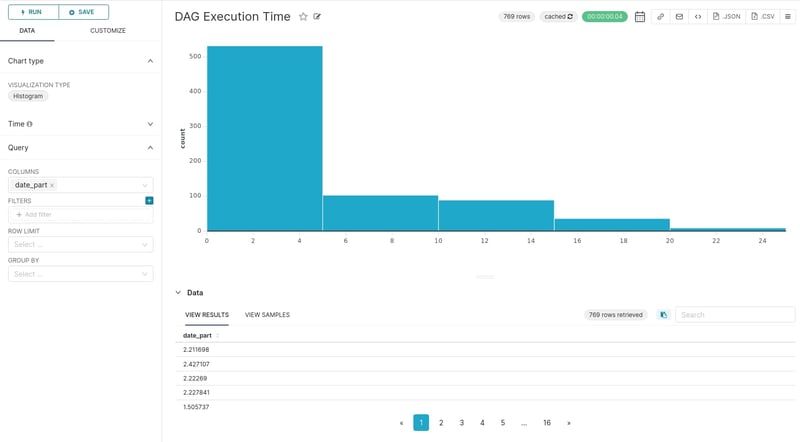
It is pretty evident that the majority of DAG executions are completed within 0 to 5 seconds. We can aggregate the execution time based on DAG id and get a glance of the average execution time per DAG.
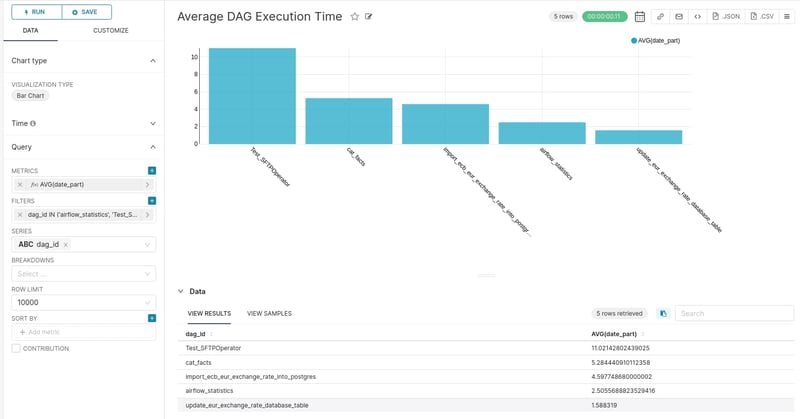
The most time consuming DAG seems to be the “Test_SFTPOperator” with almost twice the average execution time compared to the second one.
Task execution time
The charts visualizing the task execution time are similar to the previous ones, but add a more granular insight as they indicate potential bottlenecks in the execution of specific tasks that may require attention.
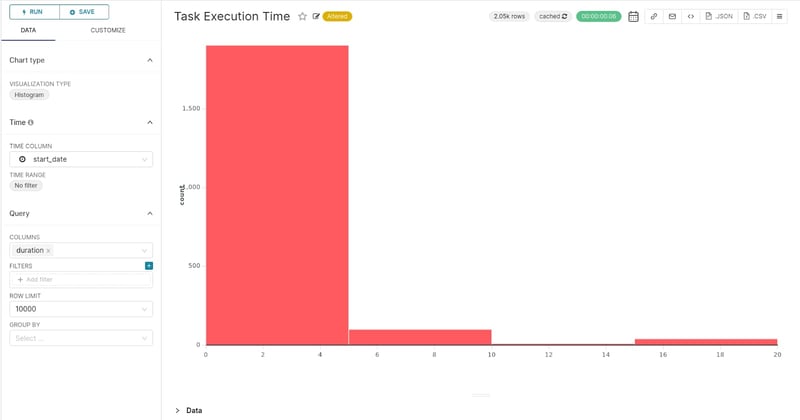
Starting with the distribution of the task execution time, it is clear that almost every task is completed within 5 seconds. Aggregating by task id, we can see how individual tasks behave.
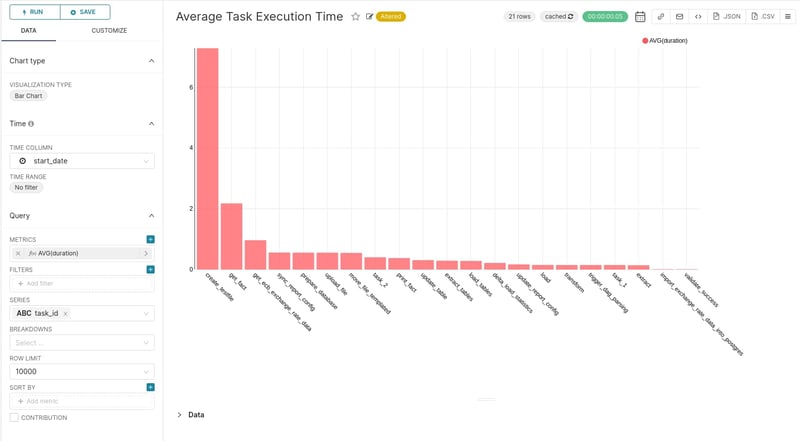
The “create_testfile” task is by far the most time consuming, with an average execution time over 7 seconds. Superset offers an alert functionality, where an email can be sent if a monitored value exceeds a certain threshold. For example, if a task is running for an unusual amount of time, an email notification can be sent to the team that is responsible for Airflow.
Creating a dashboard
Individual charts are fine, but it’s hard to draw conclusions by looking only one at a time. We can compose them into a dashboard in order to have a broader view of the ETL pipelines infrastructure.
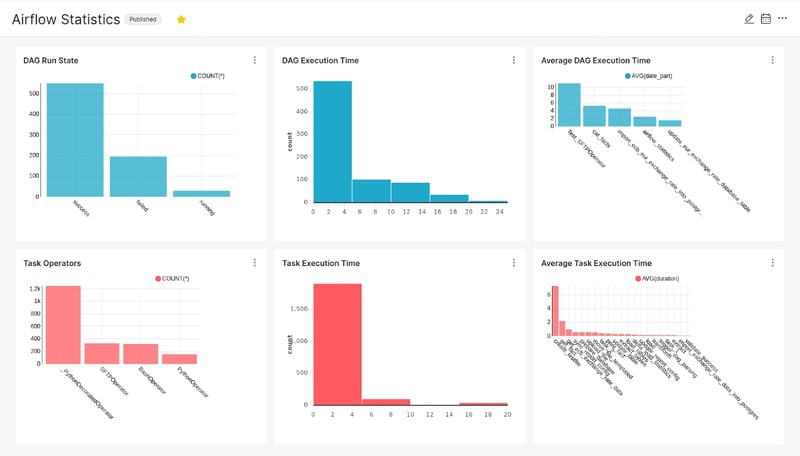
The carts can be zoomed, rearranged and manipulated at the analyst’s discretion. The Airflow DAG that is responsible for loading the tables into the database, can be scheduled to run frequently in order to keep the dashboard up-to-date.
We described some potential use cases for Apache Superset and how it can be leveraged to create business insights and most specifically, how to monitor an Apache Airflow instance. If you would like to set up your own instance of Superset or want some expert feedback for your use case, get in touch with us today.