/Logo%202023%20final%20dunkelgrau.png?width=221&height=97&name=Logo%202023%20final%20dunkelgrau.png)


SAP Analytics Cloud (SAC) simplifies data analysis and planning, with extensive dashboarding capabilities using SAC Story and SAC Analytics Designer. In addition to the dashboarding options, users are supported in simulation scenarios with machine learning, augmented analytics and smart predict. In this article we will look at these predictive analytics features in detail.
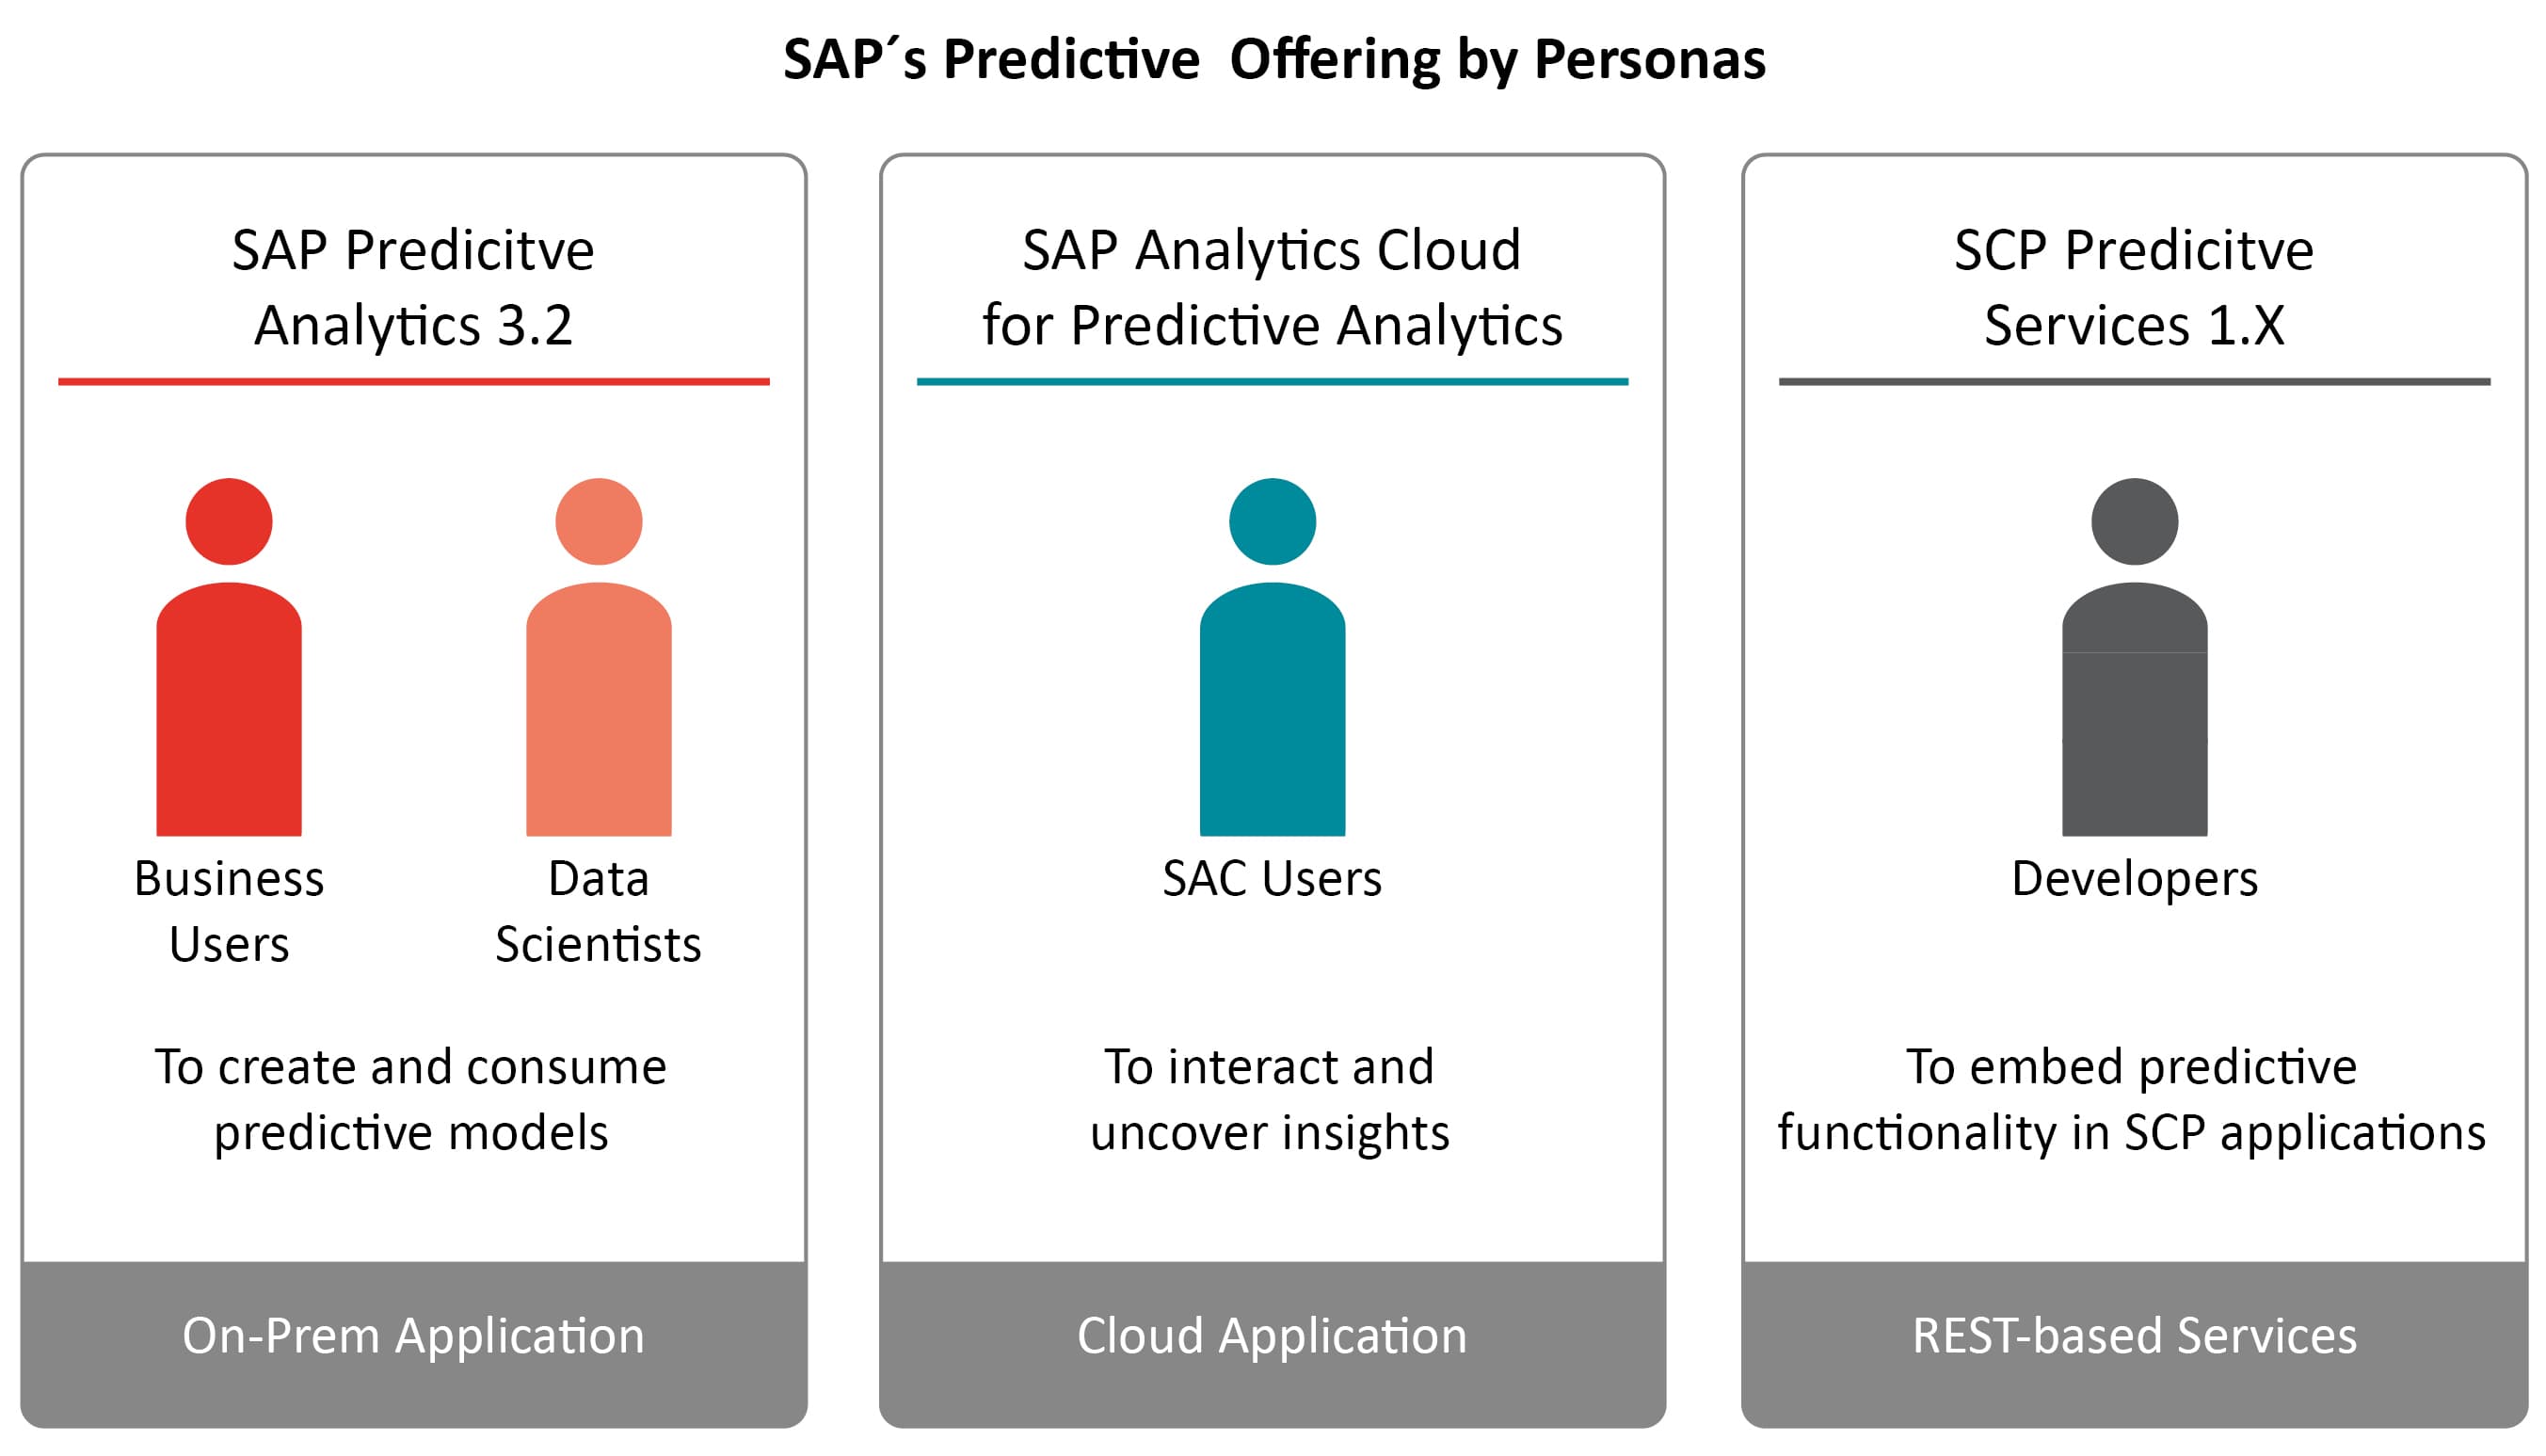
Application scenarios and user group
SAP Analytics Cloud focuses primarily on users from the business department. These can interact with predefined content and discover new insights through intuitive controls. In addition to Smart Insights and Smart Discovery, where suggestions are automatically generated, Search to Insight can also be used to ask the system questions verbally via Natural Language Processing (NLP) and receive quick answers. More experienced users can use Smart Predict to extend Smart Insights analytics with the ability to predict results.
However, trained data scientists find too little room for manoeuvre in SAC. SAP offers a separate SAP Predictive Analytics tool for them. In addition, SCP Predictive Services is positioned for developers.
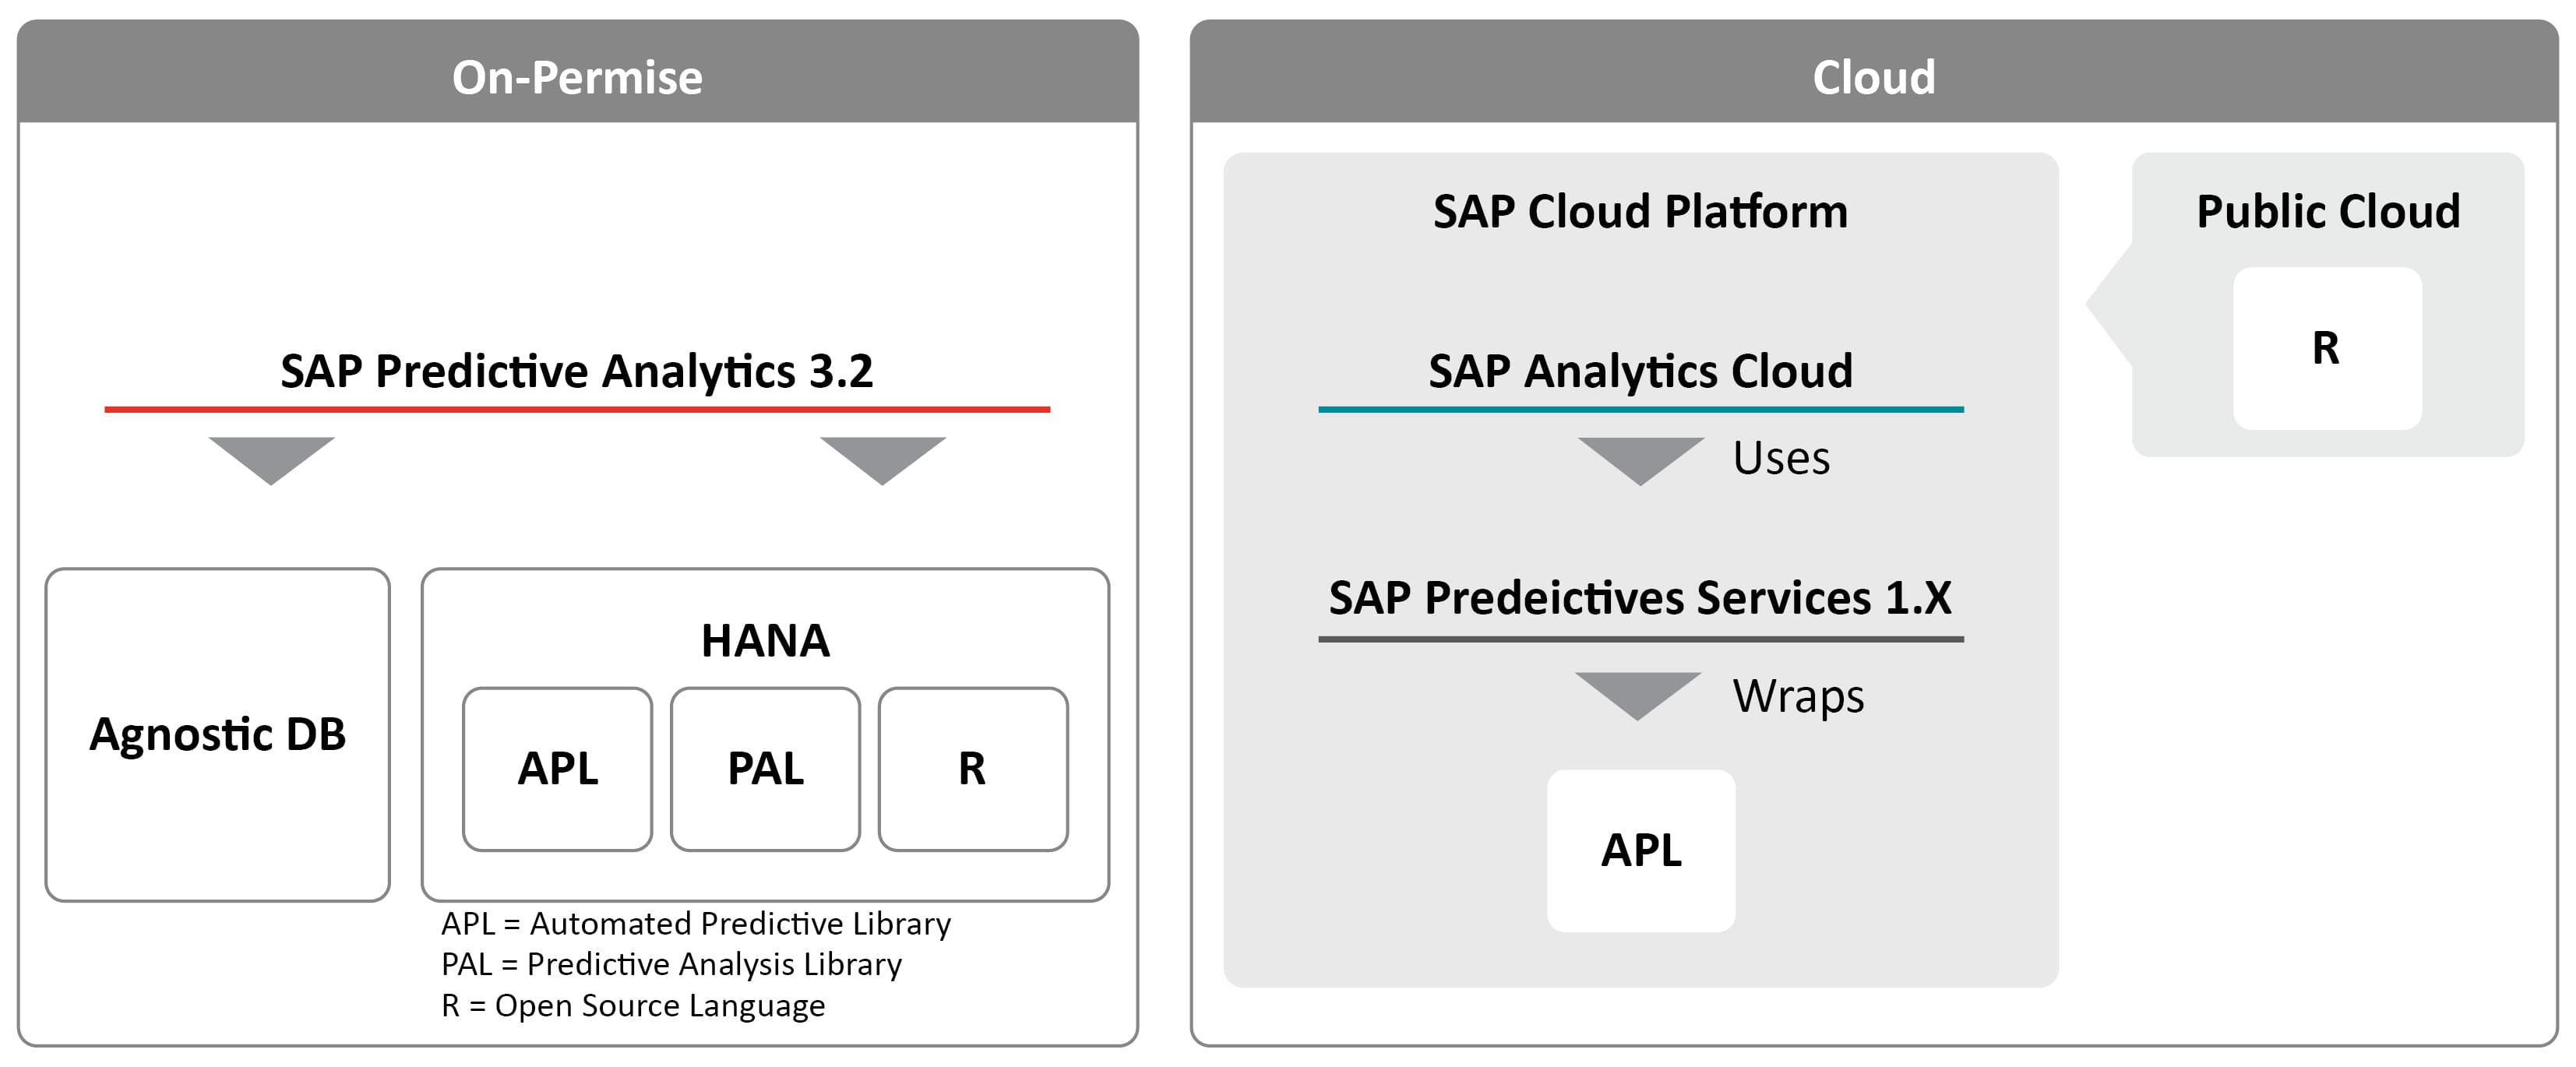
In the background, however, all applications use a common engine. For example, SAP Analytics Cloud uses SCP Predictive Services, which in turn is based on the Automated Predictive Library (APL). The same library is also part of SAP Predictive Analytics.
Detailed presentation of the predictive features
In the following, the components of Augmented Analytics and Smart Predict are presented in detail. I will explain what Smart Insights, Smart Discovery and Search to Insight are all about. Afterwards, classification, regression and time series models of Smart Predict are examined in more detail.
Augmented Analytics
Under Augmented Analytics, SAP Analytics Cloud combines functions that expand your analysis process with the help of machine learning. These include Smart Insights, Search to Insight and Smart Discovery.
Smart Insights provides additional information about a specific data point to help you gain a clear understanding of the complex aspects of your business data. With Smart Discovery, you can dig deeper and uncover new, as yet unknown, relationships in your data. And with Search to Insight, you have a Natural Language Processing (NLP) interface based on language processing. So you can talk to the system to retrieve the data you need.
Smart Insights
Smart Insights uses machine learning technologies to automatically provide insights that help you better understand your data. Additional insights are provided by clicking on a data point. Dimensions and elements with the greatest influence on the key figures are displayed.
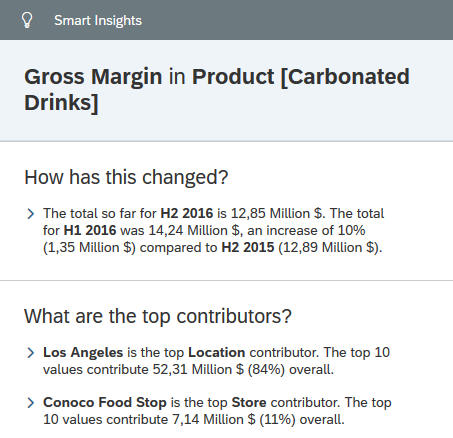
For example, if you want to learn more about your retail sales, Smart Insights can provide answers. This way you can see the most important influencing factors without having to manually navigate through the data. You save time so you can focus on higher value activities. The insights gained can be easily added to your SAC Story and visualized.
Depending on the data point selected, Smart Insight can provide answers to the following questions:
- What has changed? - You can see how your data point has developed over time
- What are the main drivers? - Highlights the influencing factors. Each influencing factor is explained using a description and a diagram
- How is this calculated? - It is shown how your data point is calculated. If it is based on a calculation, the formula used and the aggregation type are displayed. In addition, you will also see any outliers that may exist
Smart Discovery
Smart Discovery uses machine learning algorithms to uncover new or unknown relationships in your data to help you better understand the key drivers behind your KPIs. For example, you can uncover the drivers of your revenue, fluctuation or employee productivity.
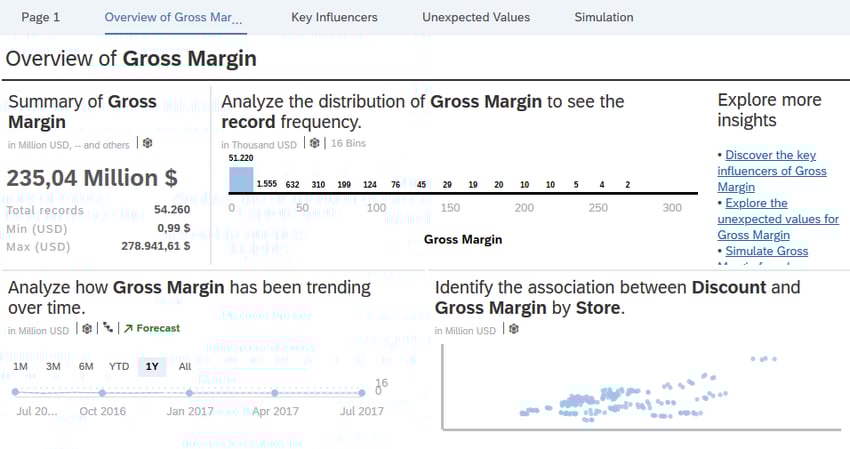
In this analysis, you can exclude certain dimensions or key figures and focus on certain dimension elements. You can then save the results as a story to share within your organization.
You can also use Smart Discovery Simulation to predict the impact of your strategic business decisions. Based on your business scenarios, you can simulate possible outcomes. You can experiment to determine how certain dimension values or key figures influence the result. For example, you can estimate the value of a new sales opportunity.
How to bring SAP BW and state of the art machine learning together
Search to Insight
Search to Insight is an interface based on natural language to query data. You can simply ask the system a question to get quick, visualized answers and integrate this information into your story.
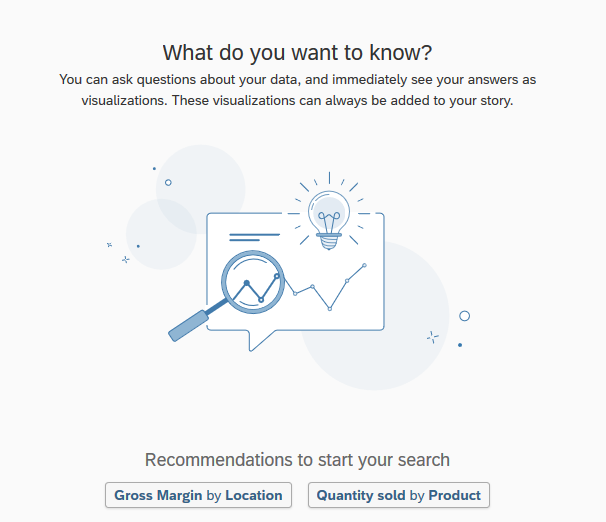
For example, you could ask the following:
- Sales in a particular year
- Sales for one or more regions
- Comparison of actual and plan values for a particular key figure in a given period
However, there is a limitation that Search to Insight understands only English. Furthermore, only predefined phrases can be used.

Smart Predict
Smart Predict extends the analysis functions of Augmented Analytics with the ability to predict results. Let's assume you have conducted marketing campaigns in the past for customers with different demographics and buying patterns. With Smart Predict, you can use this data to predict which customers will buy during a new campaign.
A machine learning model is automatically created based on the historical data. Smart Predict uses 75% of the data to find a predictive model. This model is applied to a validation subset (25% of the data) to check the predictive accuracy of the model.
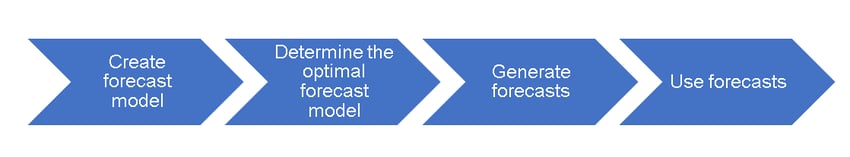
After your model has been created, the debriefing will provide you with all the important information on model accuracy, applicability to new data and important influencing factors. This enables you to assess the quality of the model. You can then use the model to generate forecasts. Alternatively, you can make a copy of the model and experiment with the parameters to achieve better accuracy and stability. You can then compare the models with each other.
Smart Predict includes classification, regression and time series scenarios. When you are trying to determine whether or not a customer will buy your new product, you are dealing with a classification scenario. If you are trying to predict a numerical value and explore the key factors behind it, you are dealing with a regression scenario. In a Time Series scenario, you try to predict a future value based on historical variations over time, seasons, and other factors. In the following, the individual scenarios in detail will be presented.
Classification
Classification scenario is used for a binary event. For example, when you try to determine whether something will happen or not. Who is expected to buy your new product? Which customer might leave, which might not?
With a classification scenario you can predict whether or not your customers will respond to a marketing offer and determine the probability for each of your potential customers. This allows you to focus on customers who are most likely to buy.
Regression
A regression scenario is used when you try to predict a numerical value and find out the key drivers behind it. This allows you to forecast business value by considering its context.
A regression scenario is used when you try to predict a numerical value and find out the main drivers behind it. This allows you to forecast business value by considering its context.
You can use Smart Predict with a regression scenario to predict the length of employee's employment. The model automatically identifies relationships in your data so that you can better understand which factors lead to long-term employment. You can use the insights gained in this process in your personnel policy to reduce employee fluctuation. Another example would be the sales forecast for a product line based on planned transportation costs and taxes.
Time Series
With the Time Series scenario you can predict future values. For example, you can forecast future sales volumes by analyzing historical sales data. You can also use additional information, such as your current sales force, marketing activities or environmental factors such as the weather, to project future trends.
The forecasts are visualized in the form of a graph so that you can immediately gain the necessary overview. You can validate the quality of the model using the confidence interval, backtesting and indicators of forecast quality (such as MAPE - Mean Absolute Percentage Error).
R Scripting
Besides Augmented Analytics and Smart Predict, you can also use your own R scripts to create customized visualizations. R is an open source programming language that includes packages for advanced visualizations, statistics and machine learning.
You can insert the R-Visualizations into your SAC Story and share them with other users. You can interact with the R-Visualizations as usual using SAC controls such as filters. If you share the visualizations with other users, they remain interactive and take into account the authorizations of the respective users.
Classification of SAC in SAP product strategy
SAP focuses strongly on SAP Analytics Cloud and is continuously developing additional functionalities. In the future, Smart Insights will be rolled out for more live data connections and Smart Discovery will also be offered for live SAP HANA connections. Search to Insight should understand more language terms and business terms in the future.
New functionalities are also being worked on for Smart Predict. The aim is to enable business analysts to examine the accuracy of forecasts. At the same time, the transition from Smart Discovery to Smart Predict should be seamless. The forecasts are also to be automatically updated in the future. So, SAC will remain exciting.
Advantages and disadvantages of SAC machine learning

SAP Analytics Cloud offers user-driven, easy-to-use machine learning methods. These are also being continuously developed. They also enable easy sharing of knowledge and collaboration. The predictive functions are integrated into the SAP ecosystem and have a user-friendly UI.
The disadvantage is the very limited functionality. Search to Insight can only recognize and use English words. Apart from the use cases predefined by SAP, no customer-specific functions are possible, at least not at present. In addition, the machine learning function represents a "black box" and does not allow control over the parameters and the result. Training of the models is automated using SAP algorithms. You cannot use your own algorithms, only the visualization can be individualized with R.
Our Summary - SAP Analytics Cloud and Machine Learning
There's no question about it, SAP Analytics Cloud offers very attractive machine learning functions for business users. The user is supported in the decision-making process. The system automatically generates insights and provides important food for thought.
These are important points for a user from the business department, but not for a data scientist. The limited functionality is particularly serious. Since it is also a so-called black box model, it is impossible to understand what happens in the background and how the results are generated. Furthermore, it is also not possible to integrate own algorithms.
If you want to improve your processes with machine learning and keep full overview and control, we recommend our white paper "SAP BW and State of the Art Machine Learning". In it, we examine SAP's machine learning portfolio and make clear recommendations.