Today's blog post introduces the new Tableau Release 2022.4. Usually, the fourth quarter update does not bring too many groundbreaking changes, but we were surprised by the improvements and new features that Tableau has introduced with this release. Read our article to find out what exactly surprised us!
Dynamically embedding images into Charts and Tables
A picture is worth a thousand words! The new Image Role feature makes it easier to understand charts and tables by using images. The new feature allows externally hosted images to be embedded using a URL field and displayed in column and row headers. For example, you can add images of your locations to HR dashboards or add images of products to analyze sales revenue diagrams. Since the images are hosted externally, the new feature does not affect the storage requirements of workbooks. However, embedding many images can negatively impact dashboard performance. Dashboards are typically rendered client-side. However, Tableau switches to slower server-side rendering when the dashboard complexity exceeds a certain level. Depending on the complexity of the dashboard, embedding images can make the difference between client-side and server-side rendering.
At the time of the feature's release, only .png and .jpg formats are supported, with a maximum size of 128KB and they need to be publicly accessible over the Internet. We're already looking forward to when the first workaround for embedding GIFs will emerge in the community. Are you? Subscribe to our newsletter to stay informed.
Improvements to Workbook Optimization
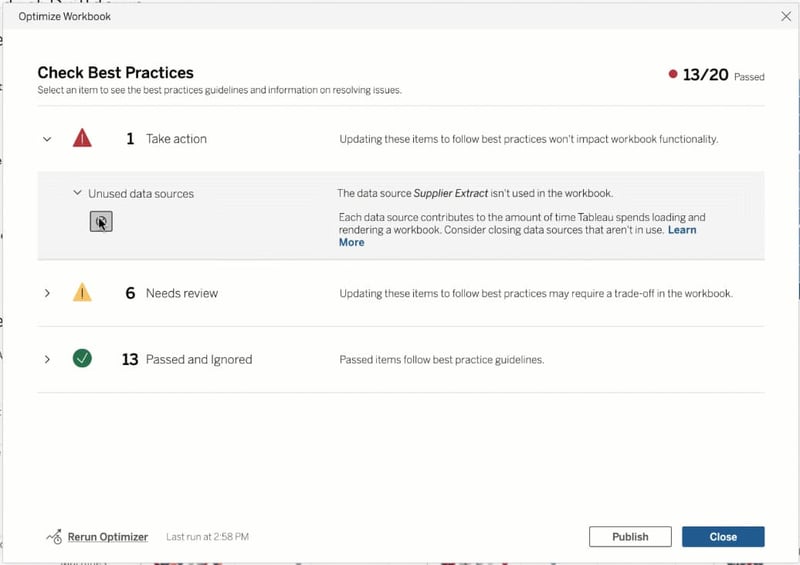
Tableau checks the dashboard against a set of predefined best practices and makes performance improvement suggestions. For example, when publishing a workbook, Tableau recommends hiding unused fields or removing unused data sources. Previously, the user had to manually implement all of the suggestions. Tableau 2022.4 expands the Workbook Optimiser to include the ability to automatically implement selected change suggestions.
Further Adjustments to the Web environment
Tableau has once again improved the web environment, bringing its web authoring functionality closer to that of Tableau Desktop. Although this time the improvements are relatively minor, affecting existing formatting options, Tableau's continued development of the web interface sends important signals. The web interface may eventually offer the same dashboarding capabilities as Tableau Desktop and make the desktop client unnecessary for some users. However, at this point, you still often run into limitations that require downloading the workbook and working with it in Tableau Desktop.
New string function: Proper
The Proper function is a text function that ensures that the letter at the beginning of a word is capitalized and the remaining letters are written in lowercase. The new feature simplifies data cleansing and eliminates the need for complicated workarounds.
Self-Service Analytics with Tableau -
Download the whitepaper here!

Replacing Data Sources and Input Steps in Tableau
Previously, replacing a data source would affect all the worksheets that were based on the data source. Now, users have the option to replace a data source only for the selected worksheet. Unfortunately, there is currently no option to select multiple worksheets, so the process must be repeated for each worksheet.
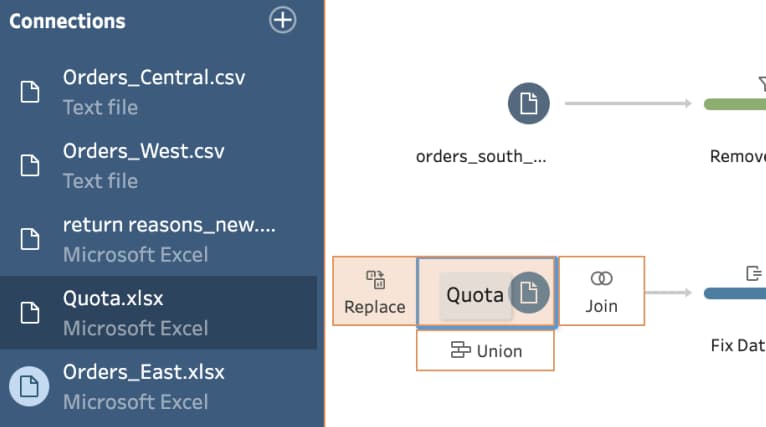
Tableau Prep also experiences a similar improvement. Users can now easily replace input steps by simply dragging and dropping. Replacing input steps previously required deleting the existing step, adding a new one, and re-establishing the connection. Although this is only a quality of life improvement, this small change can make a big difference in making adjustments to Tableau Prep workflows.
LogShark-Plugin available for Tableau Prep
Additionally, Tableau Prep gets a LogShark plugin, which enables the collection of log files and automatic creation of dashboards to analyze performance across the data flow.
Extensive Improvements for Virtual Connections
In a previous blog post, we already explained what virtual connections are and how you can implement row level security. Virtual connections allow users to set up a central access point for their source systems and control data access at the connection level. Users do not need to establish a new connection to the source system every time they create data sources or workflows, but can choose a predefined connection. After initial setup, the defined security policies are automatically applied to all downstream elements. Data access control in virtual connections is done through data policies. Previously, the database on which the virtual connection was based had to have an entitlement table that contains information about which users can see which data. Often, these entitlement tables had to be replicated in different source systems. The new release now allows for a second database to be used when setting up the virtual connection to provide the entitlement table, eliminating the need to provide authorization assignments in the same database from which the data is read.
Another improvement we welcome is the ability to update the data while editing the virtual connection. Previously, the virtual connection had to be re-opened to reflect changes in the database.
Finally, the new release has expanded the pool of possible source systems. After Tableau introduced support for cloud data sources for virtual connections last year, users can now also establish a virtual connection to Apache Spark SQL and Cloudera Hadoop, as well as other databases.
Our conclusion on Tableau Release 2022.4
The new release brings some smaller quality-of-life improvements. The most important new features are for virtual connections and the integration of images into the dashboard. Unfortunately, the virtual connection improvements are only available to customers who have licensed the Data Management Add-On. In our previous article, we mentioned that Tableau needs to catch up if the feature is to remain hidden behind a paywall. With the new release, Tableau has definitely made the add-on more attractive to many customers. Nevertheless, we still believe that the ability to define and manage security at the row level through a central point should be available in the base version.
The Image Role feature definitely opens up some new possibilities for dashboard development. However, the restrictions exclude some possible use cases, as not all images can be made publicly accessible. The file size of 128KB is also a showstopper for many application scenarios. We are very eager to see what improvements Tableau will offer in the future and will keep you informed!
Do you have questions about the features adressed in this article or other topics? Contact us! As a Tableau partner, we are happy to advise you extensively on topics such as deployment, administration, or best practices for creating effective Tableau dashboards.