/Logo%202023%20final%20dunkelgrau.png?width=221&height=97&name=Logo%202023%20final%20dunkelgrau.png)


In the first article of our blog series "How to Dashboard" we presented a Sales Dashboard professionally and visually. The second article explained how users can implement this dashboard in "SelfService" with SAP Analytics Cloud Story. Now we are going one step ahead and are building a dashboard with Lumira Designer 2.3 that can be provided to all users.
Our Blog Series "How to Dashboard" at a Glance |
Surely you have already noticed that a big change is taking place in the SAP Analytics Cloud. This also has consequences for SAP Lumira Designer, which will be replaced by SAC Application Designer in the long run. Currently (as of September 2019), Lumira Designer is still the best tool in SAP's repertoire for developing complex dashboards in corporate design. In the future, Lumira Designer will still be supplied with updates and patches, but one should not hope for big features. These are exclusively reserved for cloud solutions.
Goal
The goal is, as in the previous articles, to develop a dashboard for an international group in the pharmaceutical industry. The Lumira designer dashboard includes a home page and a detail page.
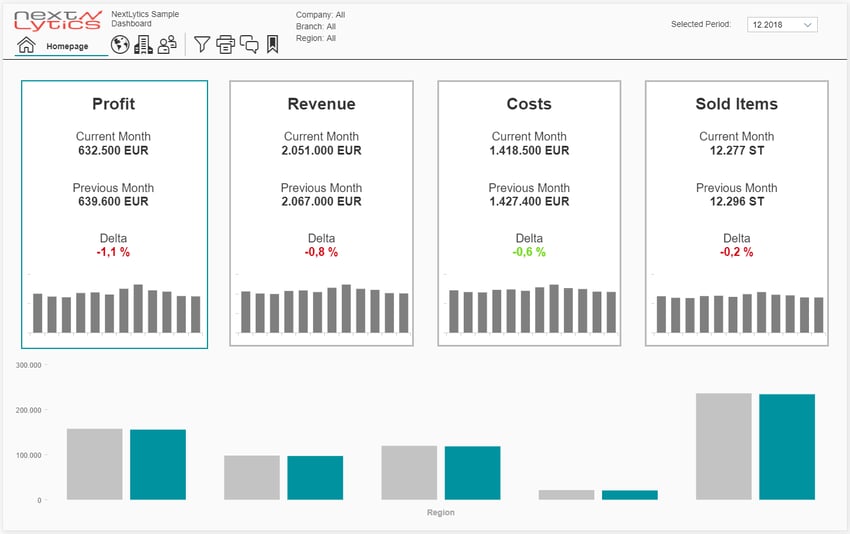
The home page contains the four most important KPIs and an interactive graphic.
The detail page picks up the information from the home page and provides the user with detailed KPIs at country level.
The dashboard consists of numerous components, scripts and CSS adjustments, which are explained exemplarily. More complex functions such as bookmarking or commenting are covered in separate blog entries.
Creation of the Dashboards
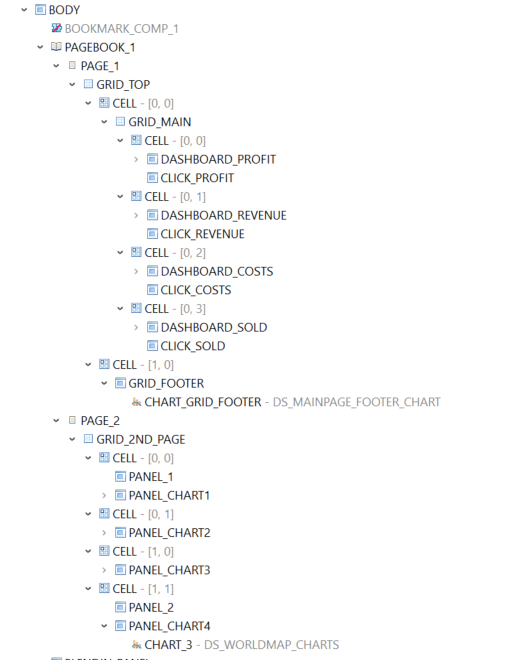
Since the switch from Design Studio to Lumira Designer, dashboards have been stored in Lumira documents. A document can contain several applications, such as different dashboards or composites. For our example, we create a new document and a new application.
Datasource
Before we start with the dashboard, a few words about the datasources. Lumira Designer can process various datasources, including SAP HANA Views, SPA BO Universes and SAP BW Queries. The most common way recommended by SAP is to use queries.
In principle, it is possible to connect existing queries that are already used elsewhere for reporting. This is also sufficient for small dashboards that only contain an overview page and a handful of interaction options. For multi-page and complex dashboards, dedicated queries should be created that only provide the data really needed.
The ultimate Comparison between SAC and Lumira Designer
Dashboard
The dashboard mainly consists of:- Panels & Grids for structuring
- Dropdowns & checkboxes for control
- Scripts & variables for mapping logic and interactivity
- Texts & Charts for the visualization of data
In the main panel there are header and body, both of which are also panels and contain all other objects.
Header
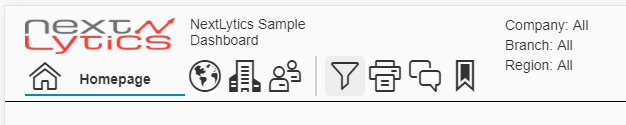
It includes logo, title, time filter, filter details, navigation and action icons. The header remains throughout all pages in the dashboard and only modifies the filters and navigation information.
Also technically the structure is quite simple and the number of elements is clearly arranged.
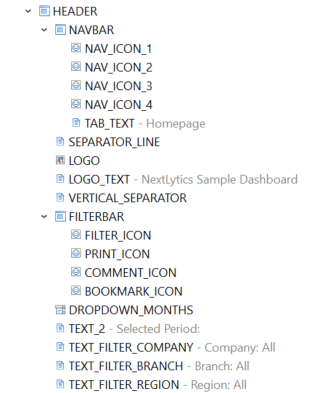
Navigation is made possible by a script that moves the text field and icons, changes the PageBook page of the body and adjusts the text to the corresponding page. The filter details are also processed and updated in the global filter script. The dropdown for the selection of the time is filled via DataBinding and set to the appropriate month in the start script.
Body - Home page
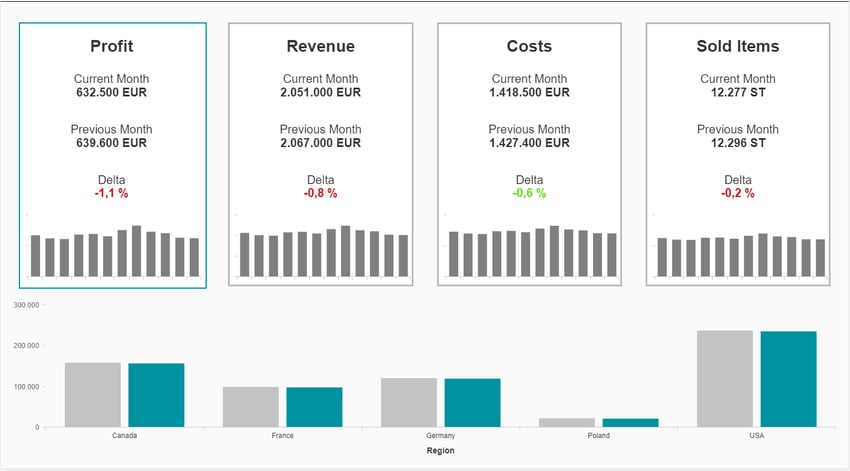
The body is more complex and contains considerably more objects. To create the different pages like main page, detail page etc. a PageBook is used. Within a PageBook page grids are used for structuring. The other objects are located within the grids and adapt to the available space. However, this is limited because the font is not scaled to one side and the charts are no longer readable after a certain size.
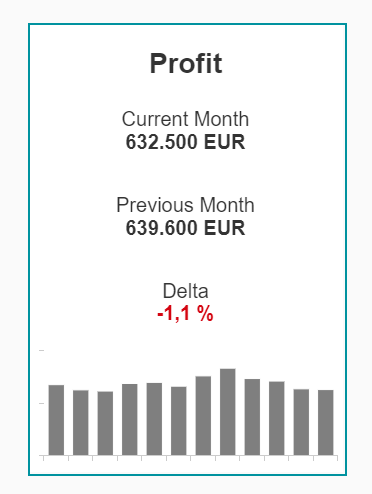
The KPI tiles are also self-made and consist of a grid, texts and a graphic. Although a KPI Chart is also available as a standard component, it does not offer enough design possibilities for our purposes. The KPIs in the tile are displayed as text and are linked via DataBinding. The selected tile is highlighted in color.
 |
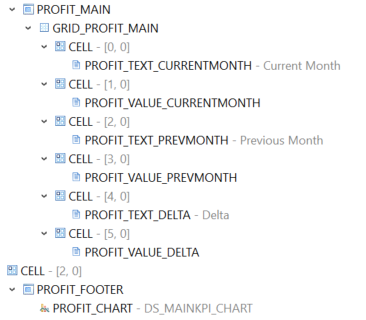 |
In order to relieve Lumira Designer, the delta is delivered from the data source, checked via a format function and suitably coloured.
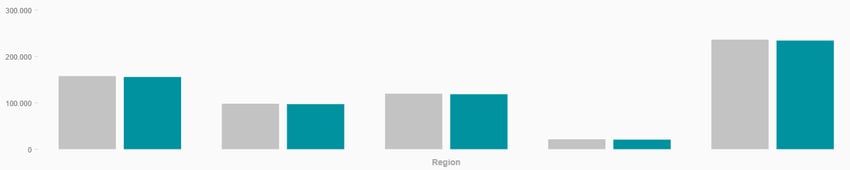
The graphic below shows the key figure of the active tile, drilled down by country. The KPI in the DataSelection is simply exchanged by clicking on the tile.
Code:
//Change KPI in bottom chart via click
if (kpi_clicked == "Profit") {
	CHART_GRID_FOOTER.setDataSelection({"(MEASURES_DIMENSION)":["0N869CFP3B3D6BYSG77B97PRE","0N869CFP3B3D6BYSG77B97W2Y"]});
}
Digression: DataBinding & Formatter Function
As mentioned above, text fields with DataBinding are used to represent the KPIs. In addition, the delta should be colored green for a positive value and red for a negative value. Therefore we use a Formater Function, which is selectable in the CSS Class DataBinding area.
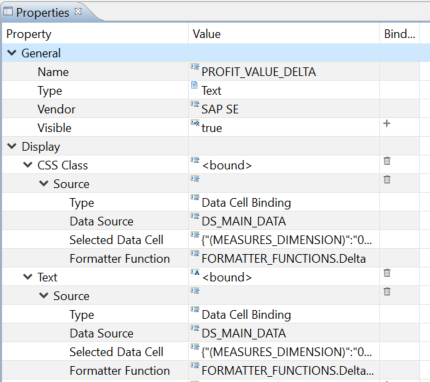
The Formatter Function is a self-created script, which is ideally written for general purpose and can be used multiple times.
Code:
//Check the incoming value and change the CSS
var css = "";

if (value < 0) {
css = "kpiTileValueMain red";
} else if ( value > 0) {
css = "kpiTileValueMain green";
} else {
css = "kpiTileValueMain";
}
return css;
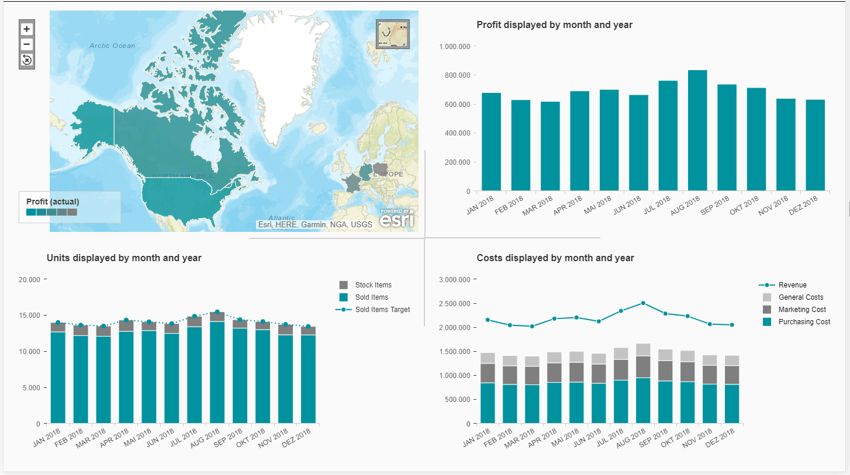
Body - Detail Page
The detail page allows you to evaluate key figures more precisely at country level. During conversion, all four key figures receive their own charts, and the level of detail is increased.
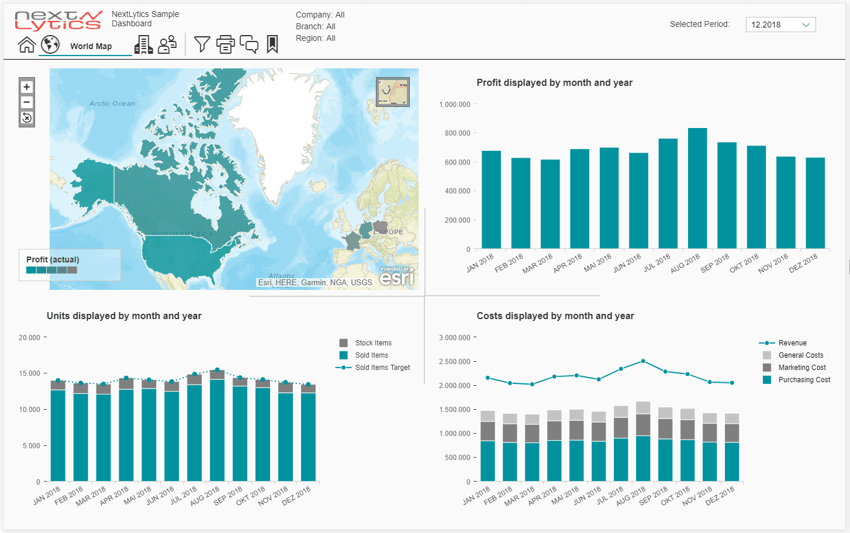
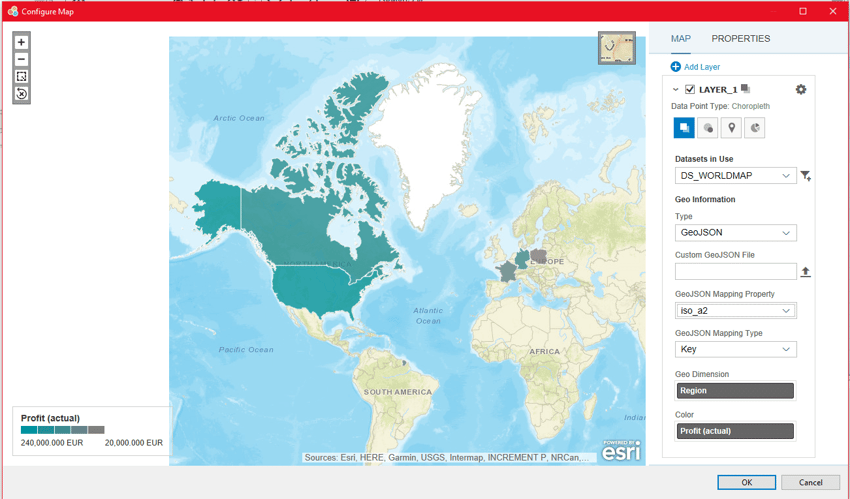
The world map is a Geomap component and is used for country selection. Simply click on the desired country. In the background the script exchanges the filter of the Datasource and thus all further charts on the detail page are updated.
While the latitude and longitude used to be mandatory, Lumira Designer can now also evaluate country abbreviations such as DE or DEU. The settings menu of the Geomap component has also been revised, as has the settings menu of the charts.
The remaining key figures are displayed in charts, sometimes combined. For example, the key figure Costs is displayed in its components as a "stacked bar chart". In addition, sales are added as a line.
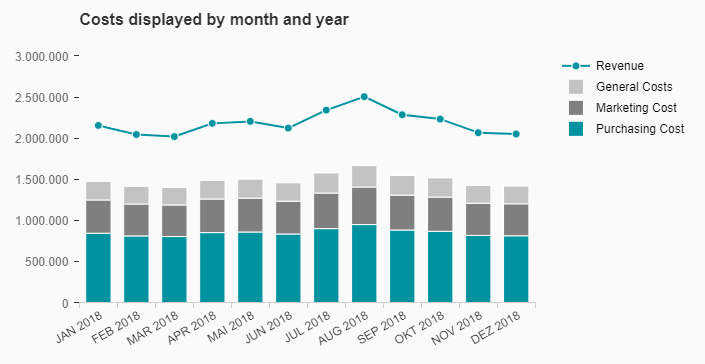
The settings window of the chart component contains many different options for visually adjusting the chart. Here you can also select whether a key figure is to be displayed as a line or a bar.
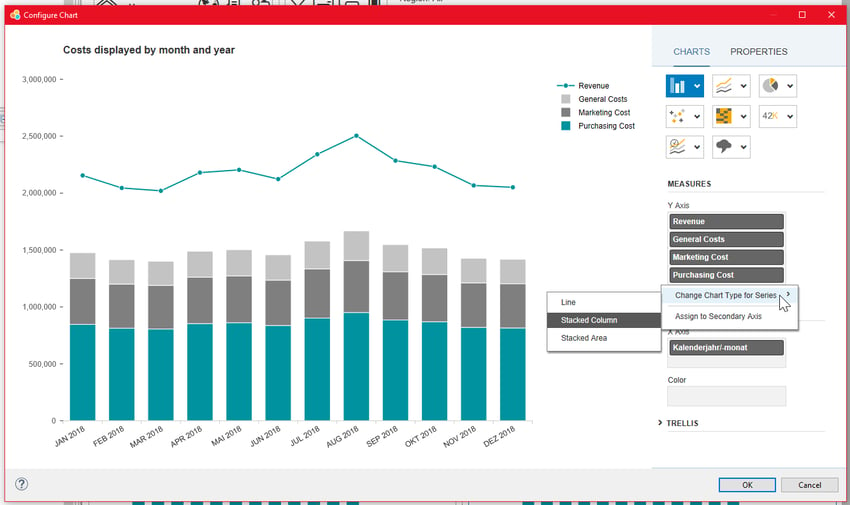
The remaining key figures are similarly linked and configured.
Global Filter
The global filter is an indispensable feature in larger dashboards. In our example it is a collapsable panel on the left side. This way, the dashboard doesn't seem overloaded, contains more WhiteSpace and space for important information. To increase the overall view, the values selected in the filter are visualized in the header.
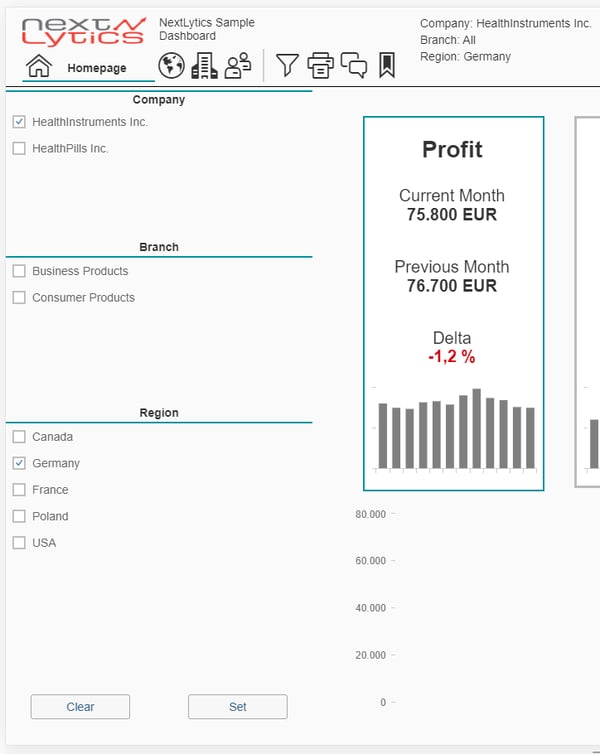
Technically, the filter can be implemented with little effort. The panel is simply "expanded" using a script, alternatively "display" and "hide" would also be possible. In the panel there are only text fields for the heading, checkboxes which are filled by databinding and two buttons for deleting and setting the filters via script. The script reads the selected fields in the checkboxes, sets the appropriate filters in the datasources and writes them as text in the header.
Code:
//Variables
var vReg = FILTER_PANEL_REGION.getSelectedValues();
var vRegText = FILTER_PANEL_REGION.getSelectedTexts();
var vRegLabel = "Region: ";

//Loop variabel content and create string
var vRegString = "";
vReg.forEach(function(element, index) {
if(element != ""){
vRegString = vRegString + element + ";";
	}
});

vRegLabel = FILTER_FUNCTIONS.setLabel(vRegText, vRegLabel);

//Set filter
DS_MAINKPI_CHART.setFilterExt("ZREGION", vRegString);
DS_MAIN_DATA.setFilterExt("ZREGION", vRegString);
DS_MAINPAGE_FOOTER_CHART.setFilterExt("ZREGION", vRegString);

//Set label
if (vRegLabel == "Region: "){
TEXT_FILTER_REGION.setText("Region: All");
} else {
TEXT_FILTER_REGION.setText(vRegLabel);
}
CSS
The Cascading Style Sheets in Lumira Designer are indispensable for layout and corporate design. On the one hand, CSS facilitates the development, since created styles can be used again and again via CSS classes. On the other hand, some Lumira standard components cannot be changed without making changes to the CSS. A frequently used component, for example, is the dropdown, which appears in "SAP blue" and looks a bit old-fashioned. With a few CSS adjustments it becomes a modern dropdown in minimalistic corporate design.
Coding:
//Change border of dropdownbox for minimalist design
.sapMSlt {
border-bottom:1px solid #00929f !important;
border-top:none !important;
border-right:none !important;
border-left:none !important;
}

.sapMSltArrow {
color: #00929f !important;
}

.sapMSltPressed>.sapMSltArrow {
background: #00929f !important;
}
Conclusion
With Lumira Designer, you can create modern dashboards that add value to enterprise reporting. It is still the most powerful dashboarding tool in the SAP portfolio, especially when it comes to complex corporate design dashboards.
In contrast to SAP Analytics Cloud, Lumira Designer does not offer any self-service, so the dashboard is created by IT or a developer. Even if the features in Lumira Designer currently exceed the possibilities of SAP Analytics Cloud, the tide will turn in the future. Large new features will only be offered for the cloud, Lumira Designer will only be provided with patches and bug fixes.