/Logo%202023%20final%20dunkelgrau.png?width=221&height=97&name=Logo%202023%20final%20dunkelgrau.png)


When using SQLScript in transformations, you benefit from an enormous performance increase. Since data is processed directly in the database, there is no need to transfer data from the database to the application server.
However, SQLScript is fundamentally different from the ABAP programming language you may be used to. Therefore, sometimes unexpected results can occur. Debugging the SQLScript is essential for the subsequent troubleshooting. In this article you will learn how it works.
So-called breakpoints are used to stop and debug the processing of the respective logic. As of SAP BW version 7.40 you can set breakpoints directly in the AMDP class. These behave just like external breakpoints in ABAP.
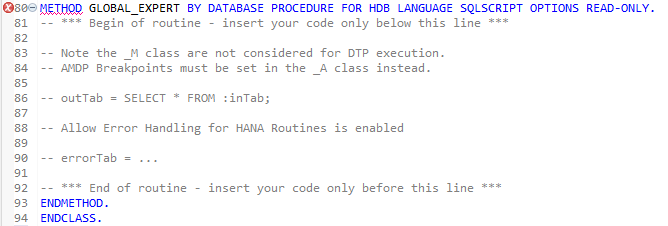
On a BW4HANA system, the procedure is slightly different. There are two classes for the transformation routine, the M and the A class. First, the logic is created in the M class. After the activation of the transformation routine, the A class is generated. In order to be able to debug the routine, the breakpoints must be set in the A class. The breakpoints set in the M class are ignored.
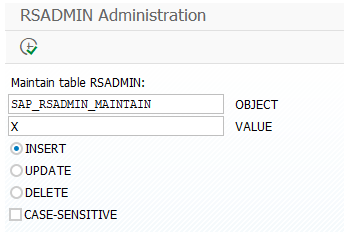
To use the debugger in SAP BW 7.40, you have to set the parameter DTP_HANA_DEBUG_SCRIPT in RSADMIN to X. To do this, use the program SAP_RSADMIN_MAINTAIN (transaction SE38).
An AMDP breakpoint can be created by double-clicking to the left of the line number. Each AMDP breakpoint is represented as a dot. It can have different colors. If the AMDP debugger is active, the dot is green. If the AMDP debugger is not active, the dot is grey. By double-clicking on the gray dot you can reactivate the AMDP debugger.
Below is an overview of possible debugger states:
|
Color |
Status |
|
blue |
This color is only displayed shortly after the breakpoint has been set. The routine must be recompiled for debugging. |
|
green |
Confirmed breakpoint, debugger is active. |
|
gray |
Inactive debugger. This can be activated through the context menu of the breakpoint. |
| white |
Deactivated debugger. This can also be activated via the context menu. |
Please note that the debugger deactivates itself after 10 minutes of inactivity. This is intended to save resources, since an activated debugger consumes a relatively large number of resources on the ABAP server.
In addition, you must know that the debugger will not start if you select the processing mode "Serially in dialog process (for debugging)" in DTP. In simulation mode, the generated SQL-statements are not executed. Instead, you must select the "Parallel SAP HANA execution" option.
However, the data is actually updated in the data target. Therefore, you must delete the requests after debugging.
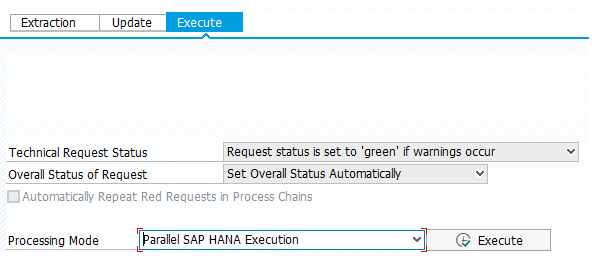
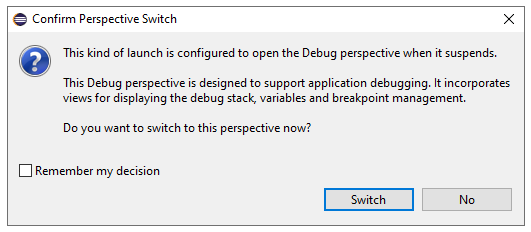
If you have now set an active breakpoint and start the DTP in "Parallel SAP HANA Execution" processing mode, the view changes to the debug perspective.
Increase the performance of your BW with SQLScript
The debugger stops the execution of the procedure at the breakpoint. Using the top bar in Eclipse, you can execute the steps in the debugger as usual. You can thus control the processing of the source code with the two buttons Resume and Single Step.
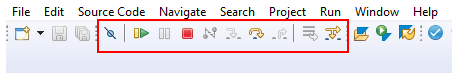
With the former, the program continues to run until it reaches another breakpoint or the end. With Single Step, as the name already indicates, only one statement is executed, then processing is stopped again.
The Debug perspective consists of several windows, which I explain below.
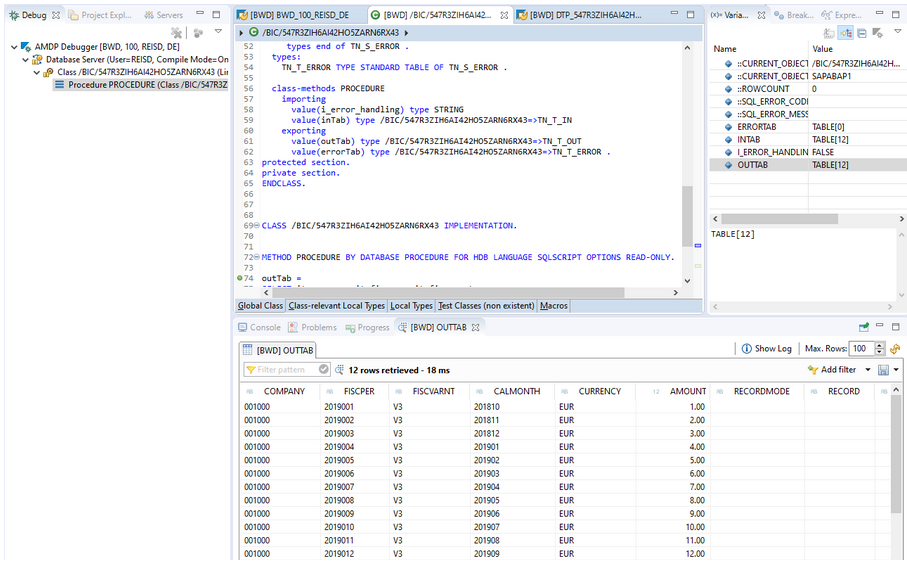
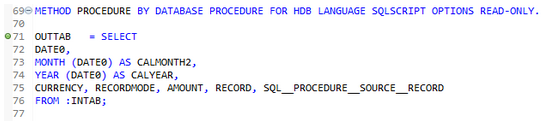
The window on the left shows the procedure and the associated class. This helps you to orientate yourself and find your way around more easily. In the middle you see your SQLScript code. On the left side next to the row number you can see a pointer that shows the number of the currently processed line.
On the right you see your variables, internal tables, breakpoints and watch expressions. Here you can see the values of the variables and view active breakpoints. If necessary, you can delete all breakpoints at once.
In the lower window you see the data preview. While the value of the scalar variables is displayed directly in the variables view, for variables based on a table only the number of rows is displayed. The data preview can be used to view the contents of the table and to check the result. Note that in SQLScript, data is not processed row by row as it is in ABAP. Instead, the entire table is processed at once.
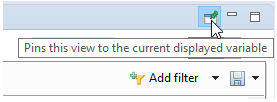
To display several tables in the data preview, e.g. INTAB and OUTTAB side by side, you can pin the view.
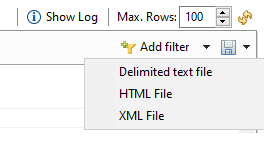
You can export the table data via Save Table, for easier analysis and troubleshooting in Excel.
SAP HANA SQLScript - Our Summary
Especially when switching from ABAP to SQLScript, it is important to deal with debugging. After you are familiar with it, you can find out any errors.
Are you planning to migrate your developments to SQLScript and need help planning the right strategy? Or do you need experienced developers to implement your requirements? Please do not hesitate to contact us and we will be happy to advise you.
Further information can be found in the book "SQLScript for SAP HANA" (SAP PRESS, ISBN 978-3-8362-7408-1) by Jörg Brandeis
