/Logo%202023%20final%20dunkelgrau.png?width=221&height=97&name=Logo%202023%20final%20dunkelgrau.png)


Due to increasing competitive pressure, it is becoming more and more important to know and address the individual needs of your customers. For a large and diverse customer base, however, it is very time-consuming and resource-intensive to provide personalized service to each customer. Customer segmentation enables the automatic identification of different customer groups with specific characteristics and buying behavior.
By improving customer understanding, targeted marketing strategies can be developed, thereby increasing customer loyalty and increasing your company's sales. Customer segmentation thus forms the basis for successful customer relationship management (CRM).
In this article, you will learn how to segment your customer base using the field-proven RFM-analysis. Furthermore, the limitations of this model will be presented, as well as alternative methods in the area of machine learning.
Customer segmentation
Several segmentation criteria are available for customer segmentation. Customer groups can be formed based on demographic characteristics (age, earnings, industry, etc.) as well as purchasing history (sales, purchasing activity, etc.). The RFM-analysis focuses on the latter. The descriptive approach impresses with its ease of implementation, intuitive handling, and pleasant flexibility.
Develop targeted marketing strategies using RFM-analysis
RFM-analysis is a multi-dimensional scoring method focusing on the following three parameters:
- Recency (R) of a customer: Days since the last purchase.
- Frequency (F) of the bookings/turnover of a customer: Number of purchases, e.g., in 6 months.
- Monetary (M) - The total turnover of a customer: Sum of sales, e.g., in 6 months.
As a result, RFM-analysis can be performed whenever a database with the required transaction information of each customer is available.
After the determination of the Recency, Frequency, and Monetary values of all considered customers, R, F, and M scores or classes are computed based on these values. These classes can be divided either by fixed intervals or by quartiles or quantiles so that each class contains the same number of customers. We recommend the first variant since no overlaps can occur, and the value range can be chosen flexibly, e.g., in coordination with preliminary information from the sales department. Besides, it is not necessary to obtain groups of the same size in customer segmentation. Customers with unusual behavior would not noticeably differentiate themselves.
The customer segmentation and calculations are shown using a randomly generated data set as an example:
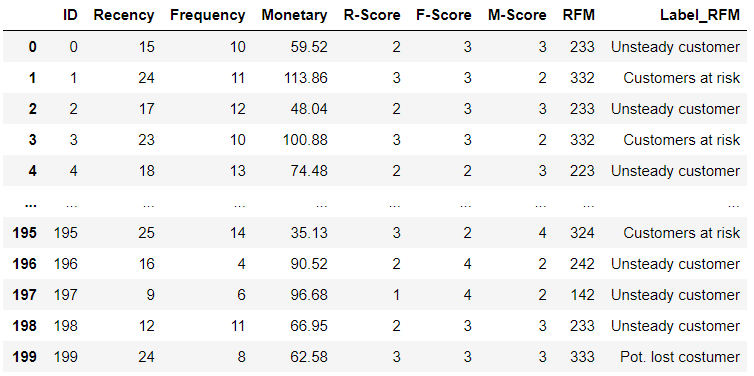
For the sake of clarity, for an example scenario, it is assumed that a small customer database of 200 customers is given. In reality, a database consists of far more customers with a great variety. In this scenario, customers are supposed to be segmented based on their purchasing behavior over the last six weeks. The selection of the considered period can vary depending on the products sold by your company. Recommended are, e.g., quarterly, half-yearly, and annual calculations.
How to bring SAP BW and state of the art Machine Learning together
The first step is the determination of the Recency, Frequency, and Monetary values of each customer. In this example, the resulting value ranges are divided into four bins and assigned to the R, F, and M-Scores 1 - 4 accordingly. Score 1 stands for the best possible result and 4 for the worst. Since high recency indicates non-recurring revenues, customers with maximum recency values get an R-score of 4. Customers who have made frequent bookings within the last six weeks and therefore have maximum frequency values get an F-score of 1. Accordingly, customers with maximum monetary values are assigned an M-score of 1. The different scores are merged into the so-called RFM-Score, which describes the respective customer quality. This value can be interpreted, in the most general sense, as Customer Lifetime Value (CLV). With four bins each, up to 64 different RFM-Scores or customer groups result. Considering the high number, it becomes difficult to detect significant differences between the groups. For this reason, the customer groups are consolidated into segments. The graphic shows an exemplary segmentation of the customer groups or scores.
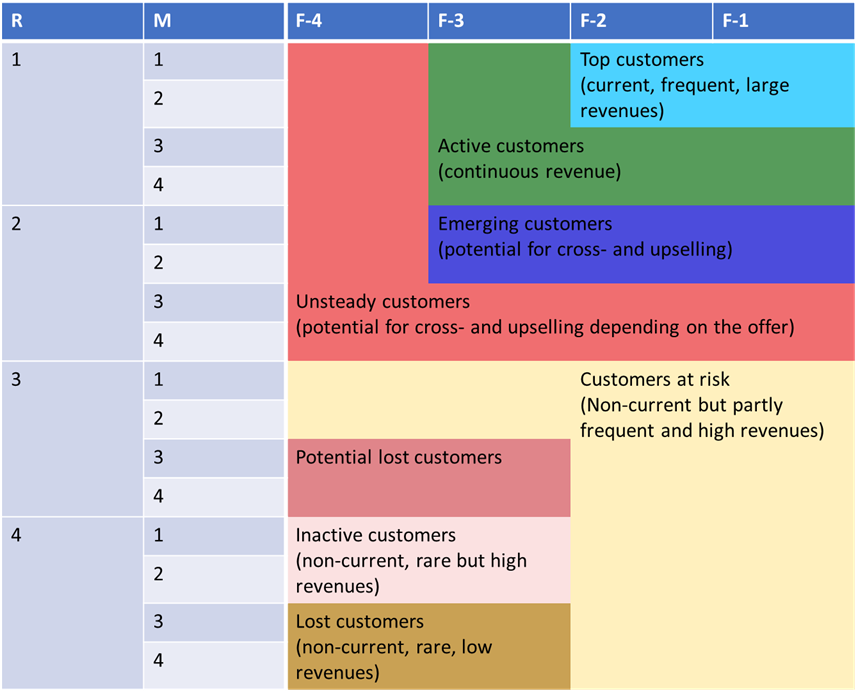
Accordingly, customers with the optimal RFM score of 111 are classified as top customers, and those with the worst RFM score of 444 are classified as lost customers.
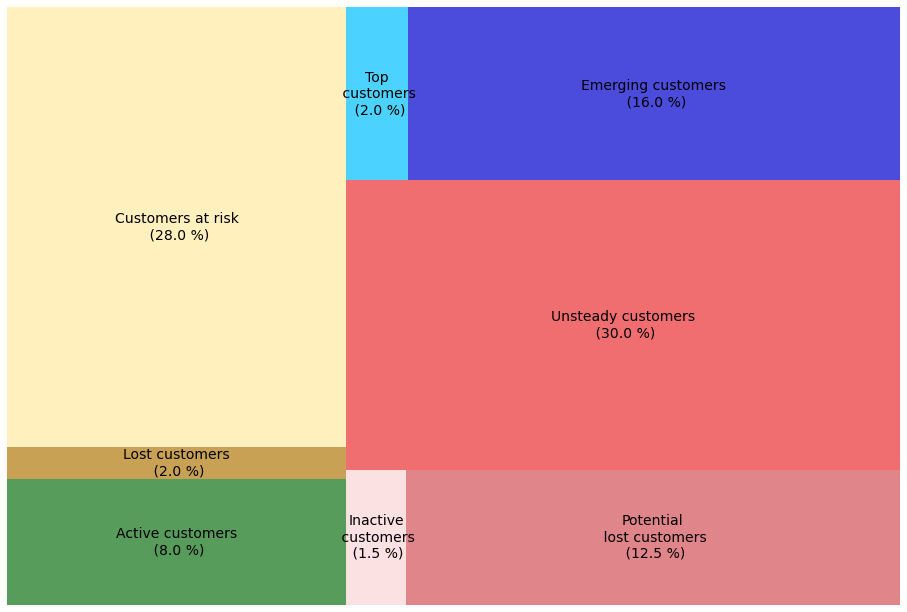
In this way, a customer database of any size can be segmented. The result of the RFM labeling on the sample data set can be seen in the following treemap:
Based on the different segments, individual marketing strategies can be developed. An example: For a high-income customer with an RFM-scoring of 421 from the segment Customers at risk, the last transaction took place some time ago. Of course, it is not advisable to lose high-income customers - but there is a risk that this customer will migrate to the competition. To prevent this, personal contact can be established by the sales department, a contract extension can be offered, and/or new innovative products can be highlighted.
Another customer with the Scoring 141 from the Unsteady Customers segment could be a new customer due to the high recency and low frequency. The high monetary value indicates a great potential to generate more revenue from this customer in the future. In this case, it is advisable to provide more support to the customer at the beginning (on-board support) and to establish a close customer relationship in the long term, for example, to present and market new products directly (cross-selling). On the other hand, a customer of the same group with a score of 214 and thus with a lower monetary value could be advertised with special offers such as quantity discounts or reduced products (up-selling).
These examples show that RFM-analysis can identify defined customer groups with distinctive business development and thus support sales and management.
Advantages and limitations of RFM-analysis
The chosen example shows that RFM-analysis can be used for a wide range of business units and business cases. The assumptions and attributes of the model can be changed in a targeted manner. For example, customers can be split up in advance based on certain characteristics (e.g., by industry) and the RFM-analysis can thus be performed on an industry-specific basis.
RFM-analysis can also be extended by the Length parameter (LRFM-analysis), which describes the number of days since the first contract was signed and how long the customer has been stored in the database.
Furthermore, the computed parameters are well suited as features for clustering methods from the machine learning area and thus offer a foundation for forecasting models. However, this shows the limitations of RFM-analysis, as it is not able to predict the future behavior of a customer on its own. It can only access past data and, for example, make comparisons with the customer's behavior in previous years. Nevertheless, the analysis is suitable for deriving short-term actions (personal contact, discounts, etc.)
Customer segmentation with artificial intelligence
Machine Learning methods are becoming increasingly popular in the field of customer management. In segmentation, clustering algorithms such as K-Means or DBSCAN are of special interest. Based on these, classification or time series algorithms can be used to predict the purchasing behavior of customers in the future. This allows early detection of customers behaving differently, e.g., due to a certain event (e.g., corona lockdown). Classification algorithms can also be used to predict whether or not a customer will react to a specific marketing offer.
The Predictive Analysis Library (PAL), as part of the SAP ecosystem, contains predefined algorithms for various applications, including customer segmentation. This enables you to perform in-database machine learning at high speed. In this blog article, we give an overview of the PAL.
RFM-analysis - Our Conclusion
It is a fact that every company benefits from customer segmentation. With RFM-analysis, different groups of customers with similar characteristics can be quickly identified and business-relevant insights can be deduced. It offers many advantages such as its universal application in various areas (finance, marketing, sales) as well as its adaptability and flexibility. However, it is only a status quo analysis which can be used in classical BI reporting to enable a basic descriptive segmentation, i.e., it quickly reaches its limits and shows weaknesses in the methodology. In contrast, methods from the machine learning area, instead of the descriptive approach, predominantly use distance metrics to determine customer segments. To optimize your processes, machine learning can be the path to success. In order not to lose the overview and control, we recommend our whitepaper "SAP BW and State of the Art Machine Learning". In this paper, we examine - in addition to the entire machine learning portfolio of SAP - an open-source supported approach based on the NextLytics Python Software Development Kit (NLY-SDK) and give clear recommendations on how you can get the most out of your data.