/Logo%202023%20final%20dunkelgrau.png?width=221&height=97&name=Logo%202023%20final%20dunkelgrau.png)


The first snow has already fallen, the year 2023 is drawing to a close and annual reviews are on the agenda. Our SAP Analytics Cloud (SAC) reporting review of the year also ranks between the funniest moments of 2023 and Spotify Wrapped. This year was eventful with many innovations in SAC, especially in the area of reporting.
MVP - Unified Story
The biggest change in SAC was undisputedly the Story update with its countless names, including "Unified Story", "Story 2.0" and "Story with Optimized Design Mode". No matter what name you use, the unification of stories and applications was the right step to expand the functional scope of stories and reduce unnecessary complexity.
The application functions were not only adopted 1:1, but in some cases expanded and improved. Developers can look forward to new API commands, for example for input filters or page handling. For end users, the now available custom widgets and the improved overview when creating the story are real highlights.
However, SAP also wanted to keep a promise it had made a long time ago. Composites were therefore also introduced in SAC this year. As is so often the case, the approach is promising, but anyone thinking about the countless possibilities of composites in Lumira Designer will have to wait a little bit longer. The composites are just a first draft and some functions such as filter control, themes, CSS, bookmarks, data change insights or advanced widgets will only be added in the coming year.
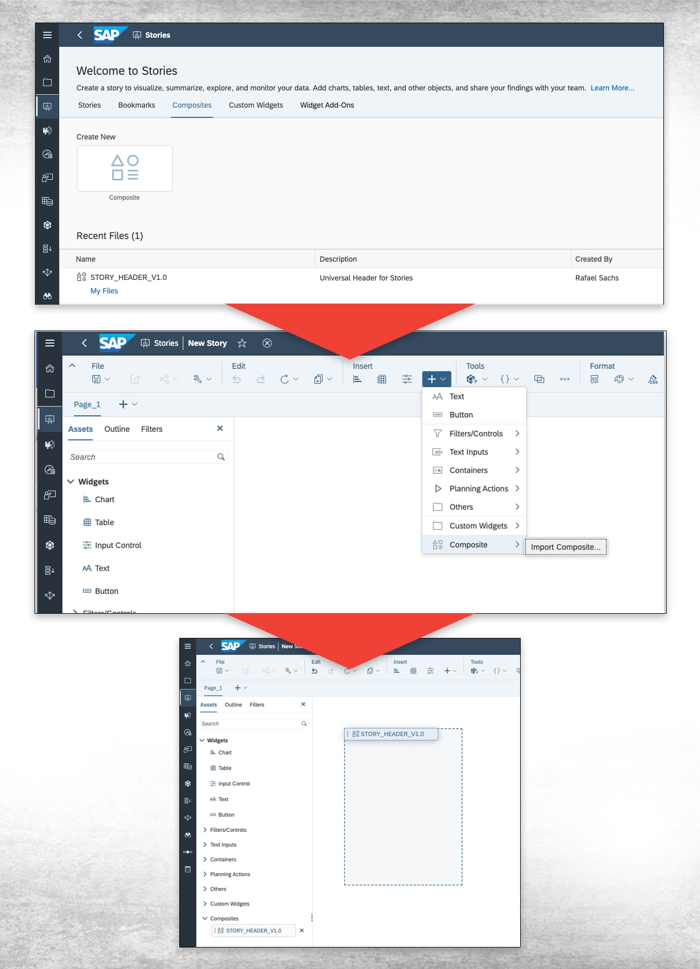
Now composites can be created in SAC and consumed in multiple stories.
Anyone who was involved in the migration of applications to Unified Stories in the middle of the year will have experienced one or two surprises. Complex applications could only be migrated with many adjustments and flexible stories had to eke out a bizarre existence in the new design without any new functions after the migration. Anyone who didn't shy away from the effort and wanted to copy one or two widgets by hand quickly discovered that it was not possible to copy widgets between tabs. SAP quickly made improvements and optimized the migration process again at the end of the year. Stories with a flexible layout can be migrated (repeatedly) so that they now also contain all the new functions. It is also possible to copy widgets between browser tabs again.
Of course, there were also numerous smaller adjustments:
- Scripting events for input filters
- Device preview
- Widgets add-ons, such as user-defined tooltips
- Optimized handling of totals within bar charts and stacked bar charts
- Optimized display of dimensions in geomaps
- Optimized story filter configuration
- Data Analyzer integration
- and much more...
Explore your Data
The Data Explorer of the classic Story was left behind this year. Some users will miss this feature, but the Data Analyzer is a more than adequate replacement. The Data Analyzer is not available directly in the Story, it is an independent tool within the platform. Thanks to the numerous updates, it has also developed into a real analysis tool. The performance, design, handling and visualization have been optimized. When the Data Analyzer was introduced, the range of functions was limited and operation was not intuitive, so there was no reason for most users to turn their backs on old tools such as the BEx Analyzer, Analysis for Office or the RSRT. At the end of the year, the Data Analyser is more and more reminiscent of a well thought-out and easy-to-use story with predefined structures, drag and drop function and some options to additionally visualize the data via charts.
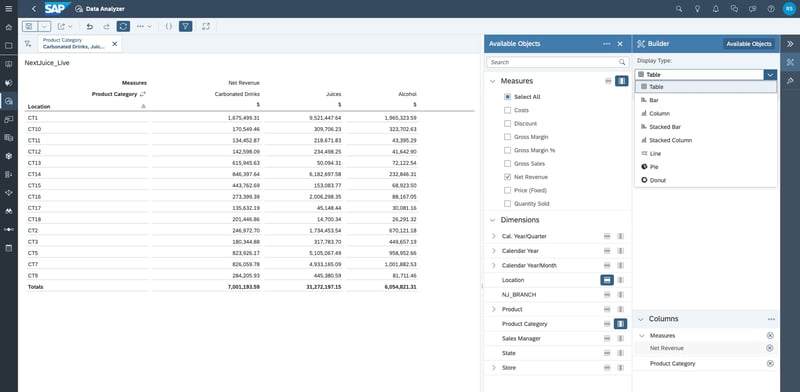
Apart from the table display, the Data Analyser can also visualize the data in different chart types.
Dashboarding with SAP Analytics Cloud -
Download the whitepaper here!

(In)-consistent
Despite the many updates, some open points remain at the end of the year. Depending on the source import, live BW, Datasphere or others, the possibilities within the SAC differ. In some cases it is just a tedious configuration, in others an inadequate API command or a completely missing function.
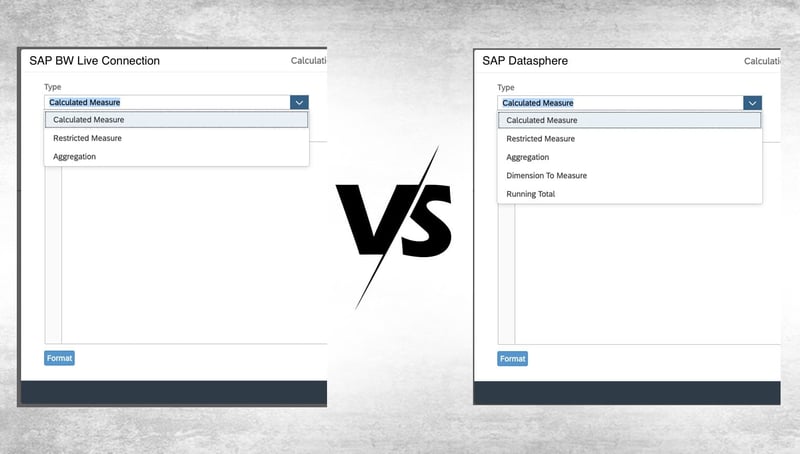
Depending on the source, different options are revealed within a story.
Even with a lot of optimization, SAC Stories are not always fast in 2023. At first glance, the major shortcoming of performance has improved significantly, but at second glance it can also be described as "shifted". Generally speaking, the unified stories load faster as less data is initially loaded. This can lead to fast stories including smooth navigation or to waiting 10 seconds for an input filter that only provides 5 values. The performance deficits can usually - but not always - be identified in the data source. SAP must continue to optimize performance in the coming year in order to keep up with other tools such as Tableau or PowerBI.
Besides reporting
Although our focus is on reporting, it should not be forgotten that the planning area also benefits from the unified story. However, other areas in SAC have also been optimized, for example:
- Data Integration - optimization of SAP ERP connections
- Data Modeling - optimization for formulas with LOOKUP, RESTRICT and TOPERIOD
- Enterprise Planning - optimization of validation rules, data actions, forecast layout, calendar and process management
- Microsoft Office integration
In addition to the developments in the SAC, this year was also consistently interesting for Datasphere customers, especially in relation with the SAC. The new Analytic Model now offers familiar functions from the Query Designer in Datasphere. This means that some key figures, such as exception aggregations, no longer need to be calculated in SAC, which improves performance.
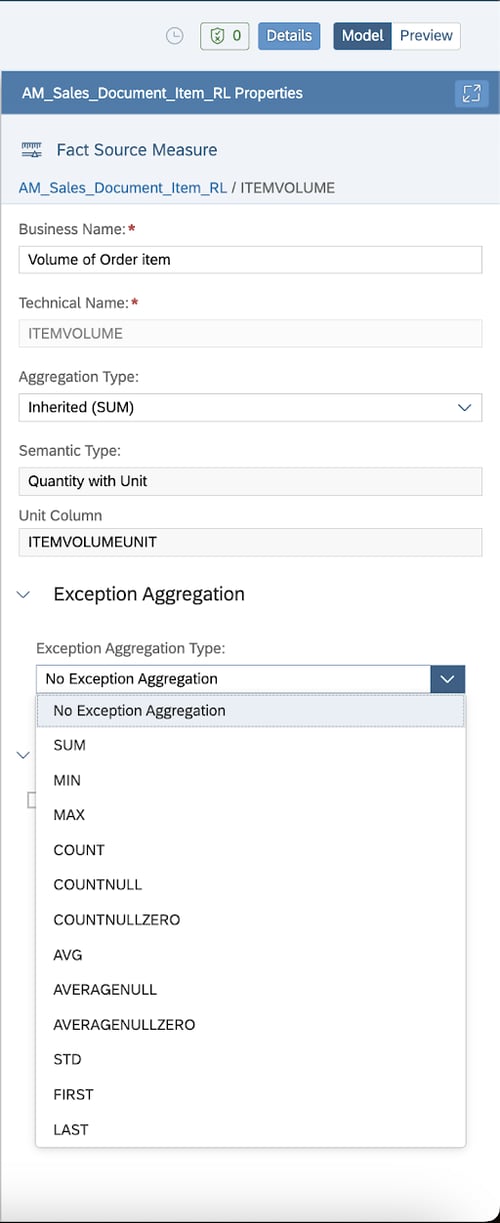
Creation of key figures with exception aggregation in Datasphere
But even apart from the analytic model, the combination of Datasphere and SAC is most like a "one-stop shop" or simply "most convenient" tool. This is of course due to SAP's cloud-first strategy, but also to the integration of the two tools in the cloud.
Reporting year in review - Our Conclusion
This was an eventful year for SAC, in which important milestones were reached and promises kept. Especially in systems with a beta release cycle, it was often noticeable that a lot is happening in SAC, unfortunately not only through positive new features. One or two bugs have also managed to crawl past quality control for the final version. Overall, the retrospective is positive and SAC developers and users can look forward to the upcoming year.
Do you have questions about SAP Analytics Cloud or another topic? Are you trying to build up the necessary know-how in your department or do you need support with a specific issue? Simply get in touch with us - we look forward to exchanging ideas with you!