/Logo%202023%20final%20dunkelgrau.png?width=221&height=97&name=Logo%202023%20final%20dunkelgrau.png)


















SAP Datasphere provides built-in monitoring capabilities for reviewing storage consumption, task execution, and overall system activity. This is useful for day-to-day administration, however monitoring screens alone do not always answer the longer-term questions technical and business teams need to explore such as:
-
Which SQL statements repeatedly consume the most time or memory?
-
Are performance issues increasing after a release, data-load change, or new reporting requirement?
-
Which workloads should be investigated, optimized, or tracked over time?
-
Can technical monitoring data be combined with operational or business context in an Analytic Model (AM)?
A practical way forward is to make selected monitoring data from the SAP HANA SYS schema available in a SAP Datasphere SPACE as data assets.
What Are SAP Datasphere SYS Monitoring Views and How Do They Work?
The SYS schema contains system and monitoring views that provide both structural and runtime information about the underlying SAP HANA database.
Some views provide relatively stable metadata, such as table or column information. Others provide insight into workload and performance, including:
-
M_EXPENSIVE_STATEMENTS
-
M_MULTIDIMENSIONAL_STATEMENTS
-
M_MULTIDIMENSIONAL_STATEMENT_STATISTICS
-
M_SQL_PLAN_STATISTICS
and plenty more.
These views are highly useful for technical analysis. However, they are not automatically available as reusable reporting objects in a Datasphere space. In addition, monitoring information can be transient: records may be cleared, replaced, or become unavailable after system events or retention limits are reached.
That makes historical reporting difficult unless the data is captured deliberately.
Wrap, expose and consume SYS Views
Since it's infeasible to expose the complete SYS schema, create a controlled wrapper view in the schema view with a database user. The wrapper can expose the fields required for the relevant reporting or monitoring scenario.
For example, a database user can create a view over M_SQL_PLAN_STATISTICS:
CREATE VIEW "NL_GENERAL#MANTOUSIS"."MONITORING_SQL_PLAN_STATS" AS
SELECT
 *
FROM "SYS"."M_SQL_PLAN_STATISTICS";
For productive use, replace SELECT * with an explicit list of required columns. This makes the object easier to maintain, reduces unnecessary data exposure, and supports a least-privilege design.
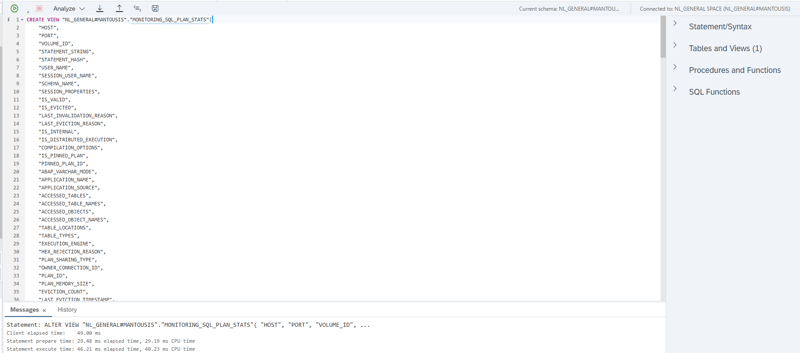 Wrapper view created in SAP HANA Database Explorer
Once the view has been created and the required permissions are in place, it can be made available to the relevant Datasphere space, that’s NL_GENERAL in our scenario. The view then appears as a source under the database user in the Sources browser when you're trying to create a new view.
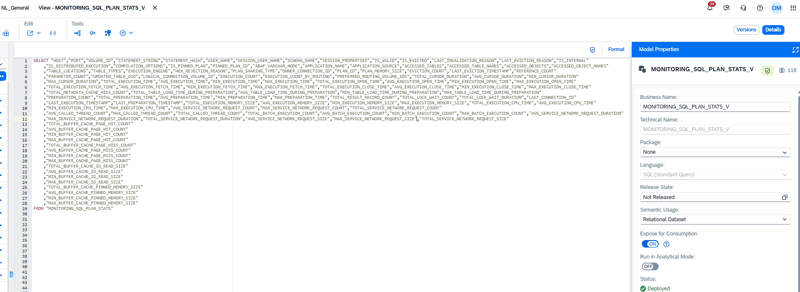 SYS wrapper view available as a source in SAP Datasphere
From that point onward, the system-monitoring data can be used like any other Datasphere source.
Watch the recording of our webinar:
"SAP Datasphere and the Databricks Lakehouse Approach"
Report on current system behaviour
A Datasphere view built on top of the wrapper can provide immediate visibility into expensive statements, SQL-plan activity, or multidimensional-query behaviour. Additionally it provides a flexible way to extend your monitoring in any way you require.
This supports focused monitoring dashboards based on the organisation’s own KPIs, thresholds, and operational processes, rather than relying only on standard monitoring screens.
System-monitoring data can also be combined with technical or business context. For example, SQL-plan trends could be analysed by reporting period, project release, data-load window, application, or business process.
By using the standard modelling approach for this, culminating in an Analytic Model, we can consume this report like any other: in SAC with a dedicated Story/Dashboard.
Build a historic monitoring view using data flows
Live monitoring views are not intended to serve as a long-term historic layer. To retain SQL-plan statistics over time, you can for example create a scheduled Data Flow that reads the Datasphere view and writes the results to a local history table.
In this example, the Data Flow DF_MONITORING_SQL_PLAN_STATS can run daily and store a dated snapshot of the MONITORING_SQL_PLAN_STATS view.
M_SQL_PLAN_STATISTICS →
MONITORING_SQL_PLAN_STATS →
DF_MONITORING_SQL_PLAN_STATS →
MONITORING_SQL_PLAN_STATS_HISTORY
The history table should include a snapshot timestamp so that each execution can be analysed in context. To achieve that, configure the Data Flow to append records rather than overwrite them to maintain a daily log.
This creates a reliable historical layer for identifying recurring SQL-plan patterns, comparing system behaviour before and after changes, and investigating long-term performance trends.
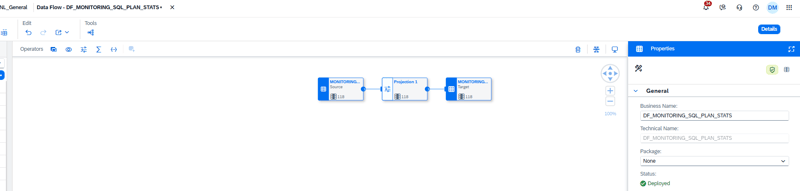 Data Flow DF_MONITORING_SQL_PLAN_STATS loading daily SQL-plan statistics into a local history table
Hint: Depending on the source data, it might be necessary to add the Current System Timestamp as a calculated field and define this as an additional primary key in the target table to achieve a daily snapshot.
What Security and Performance Considerations Apply When Exposing SYS Views?
A strong implementation should remain selective, secure, and manageable:
-
Expose only the SYS views and fields needed for the use case.
-
Filter unnecessary technical records or columns as early as possible.
-
Treat SQL text and user-related fields carefully, as they may contain sensitive information.
-
Define a retention policy for the history table to avoid creating unnecessary storage growth.
-
Consider a suitable deduplication key if the Data Flow can be triggered more than once per day.
-
Consider a quick feasibility test for each object as access might be blocked by SAP.
Custom monitoring in SAP Datasphere: Our Conclusion
SAP Datasphere standard monitoring provides useful operational visibility, but selected SYS monitoring views can deliver far more value when they are brought into the analytics layer in a controlled way.
By wrapping relevant SYS views through a database user, exposing them to a Datasphere space, and persisting selected snapshots through Data Flows such as DF_MONITORING_SQL_PLAN_STATS, organisations can move from point-in-time monitoring to reusable reporting and historical analysis. Building an Analytic Model and SAC Story on top, provides further benefits.
The result is straightforward: monitoring data becomes a governed analytics asset and can be extended in a flexible way, just like all your other reporting.
Stay tuned for a follow-up blog, where we took this a step further and implemented a custom monitoring solution for a client with dynamic SQL, to report on data quality and load behavior.
If you are looking to unlock deeper system visibility, automate custom dynamic SQL monitoring, or turn your operational logs into actionable analytics models, let's talk. Reach out to our team today to discuss your specific architecture and design a tailored monitoring strategy for your organization.