/Logo%202023%20final%20dunkelgrau.png?width=221&height=97&name=Logo%202023%20final%20dunkelgrau.png)





















In our article “The hidden JSON-Hack for Database Hints in SAP Datasphere”, we showed you how to correct faulty or slow analytical models in SAP Datasphere using database hints. You can use PlanViz to track the execution of queries step by step. In this article, we will show you how to generate PlanViz files for SAP Datasphere analytical models.
While the generation of PlanViz is integrated into the user interface for SAP Datasphere transformation flows and views, for analytical models you need to take a small detour to obtain the required information.
Prerequisites for Generating PlanViz for Analytical Models
First, open the developer tools in your browser, e.g. in Chrome via Menu → More Tools → Developer Tools, or use the keyboard shortcut Ctrl+Shift+I.
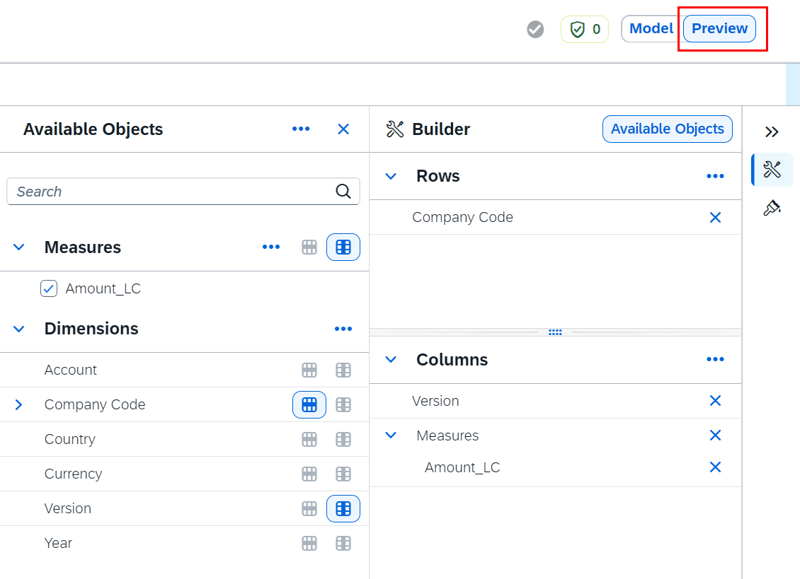
Then, in SAP Datasphere, open your analytical model in Preview mode.
Drag the required dimensions and measures into rows or columns and set the filters to reproduce the performance issue or faulty calculation.
Switch to the Network tab in the developer tools and set the filter to GetResponse. The first result corresponds to the exchanged metadata, while the subsequent ones, which start with Analytics, correspond to the respective drilldown in Datasphere.
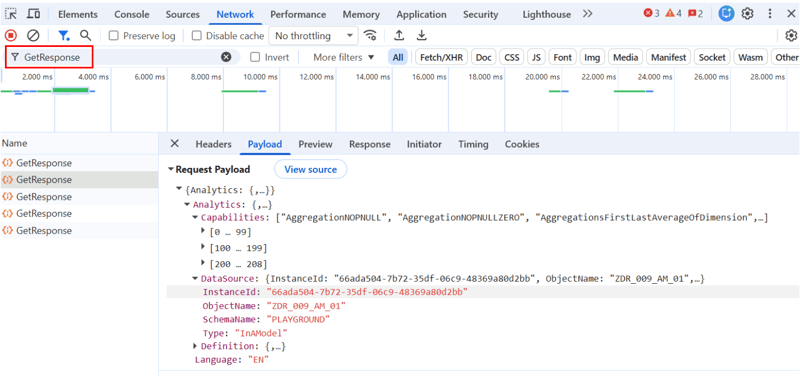
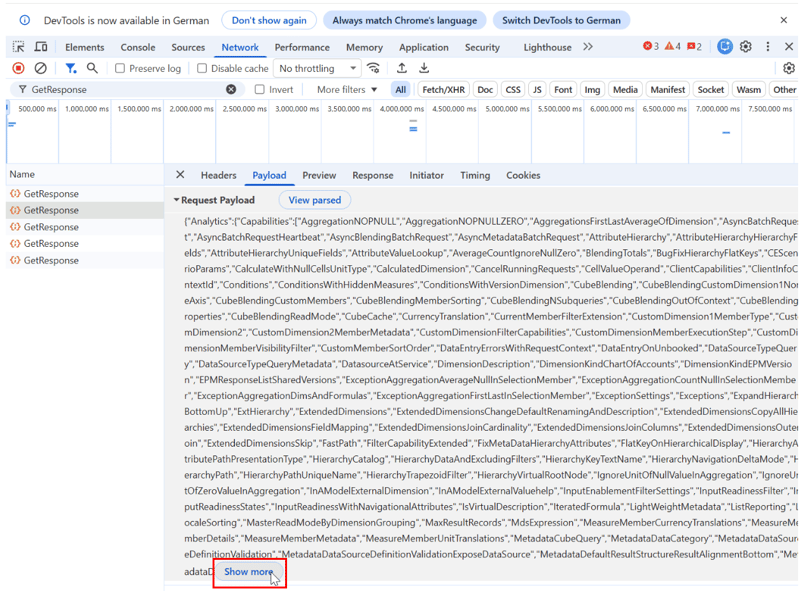
Now click on View source under Payload, and then click on Show more to display the full query.
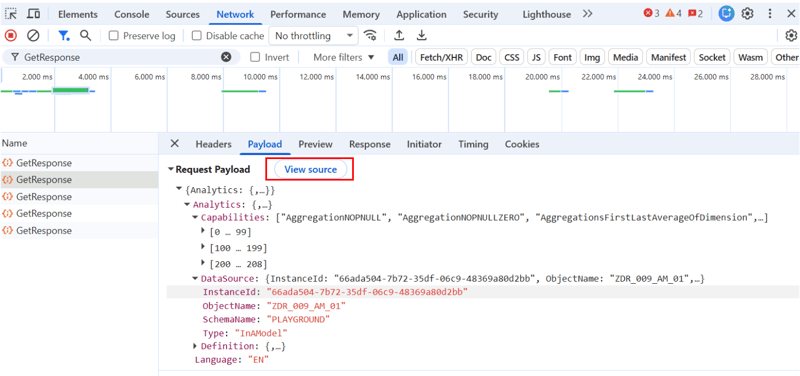
Then copy the entire query to the clipboard.
Watch the recording of our webinar:
"SAP Datasphere and the Databricks Lakehouse Approach"
How to execute the Analytical Model Query in SAP HANA Database Explorer
Internally, SAP HANA Multi-Dimensional Services (MDS) are used to process queries in SAP Datasphere. These are translated into an execution plan for the SAP HANA Calculation Engine or into SQL, which is executed by the HANA core engines. We want to reproduce this on the HANA database.
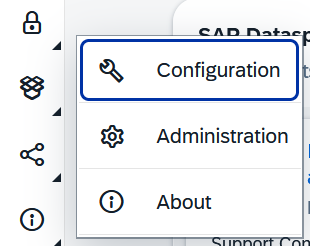
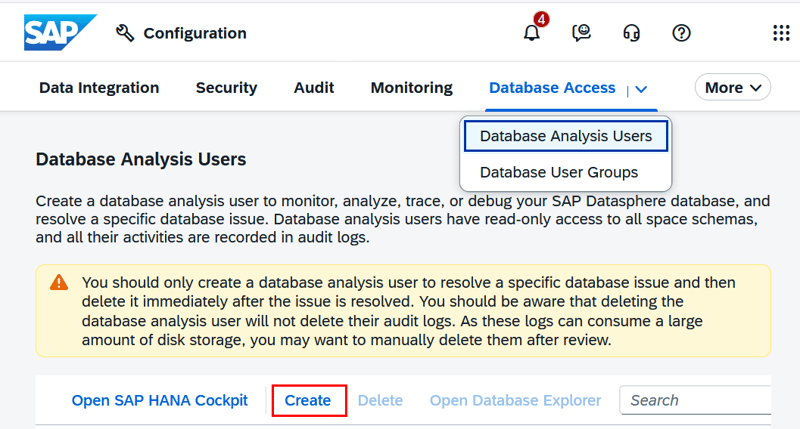
For this, we need a database analysis user. To create a new user, follow the menu path System → Configuration → Database Access → Database Analysis Users.
Create a new user via Create and copy the password. Then click on Open Database Explorer and log in with the newly created user.
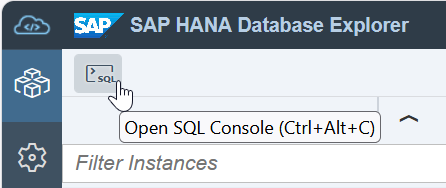
Open the SQL console in the SAP HANA Database Explorer.
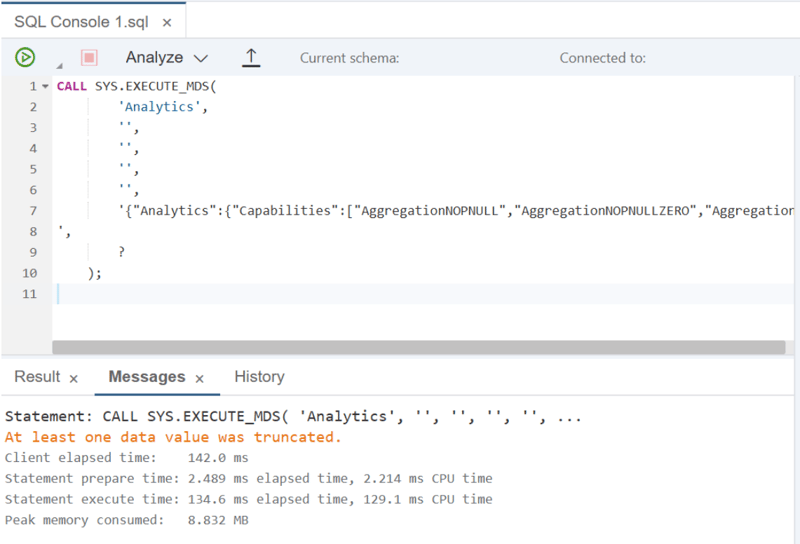
Copy the previously copied payload into the following CALL SYS.EXECUTE_MDS command.
CALL SYS.EXECUTE_MDS('Analytics', '', '', '', '',
'<Insert the copied payload here>' , ?);
After execution, you can view the required time under Messages tab. Even at this point, you can check whether this matches the time required in SAP Analytics Cloud and thus narrow down the cause of long-running reports.
Generate the PlanViz Analysis File
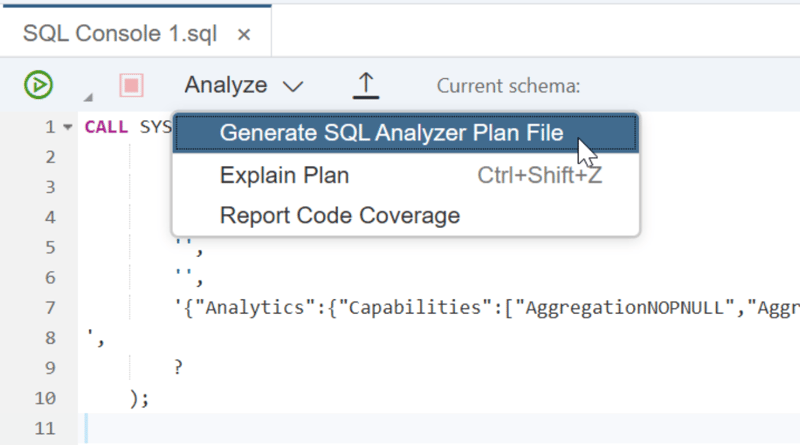
To generate the PlanViz analysis, select the entry Generate SQL Analyzer Plan File under Analyze.
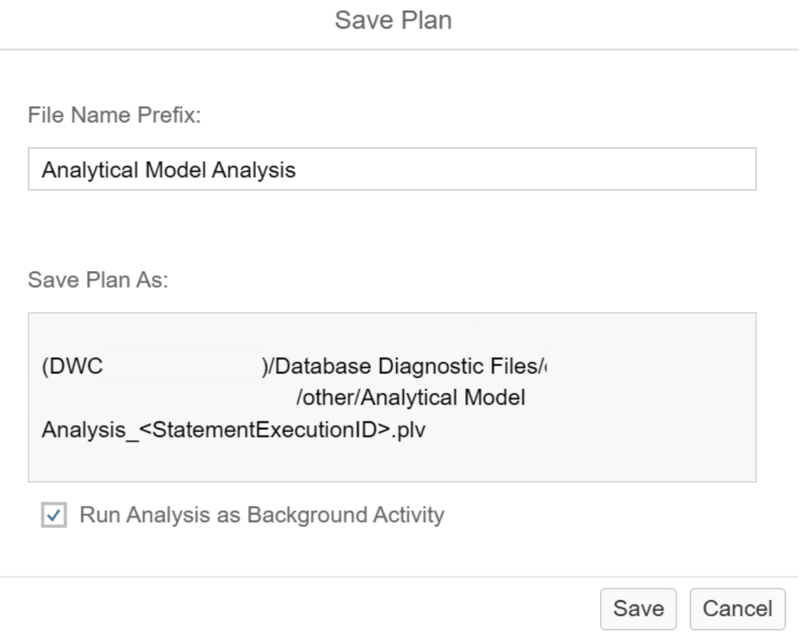
Assign a specific name. For longer-running requests, ensure that the generation is executed in the background by activating the Run Analysis as Background Activity option.
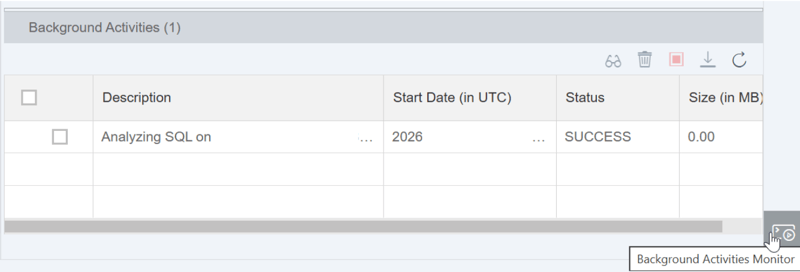
You can view the background activities at the bottom right in SAP HANA Database Explorer.
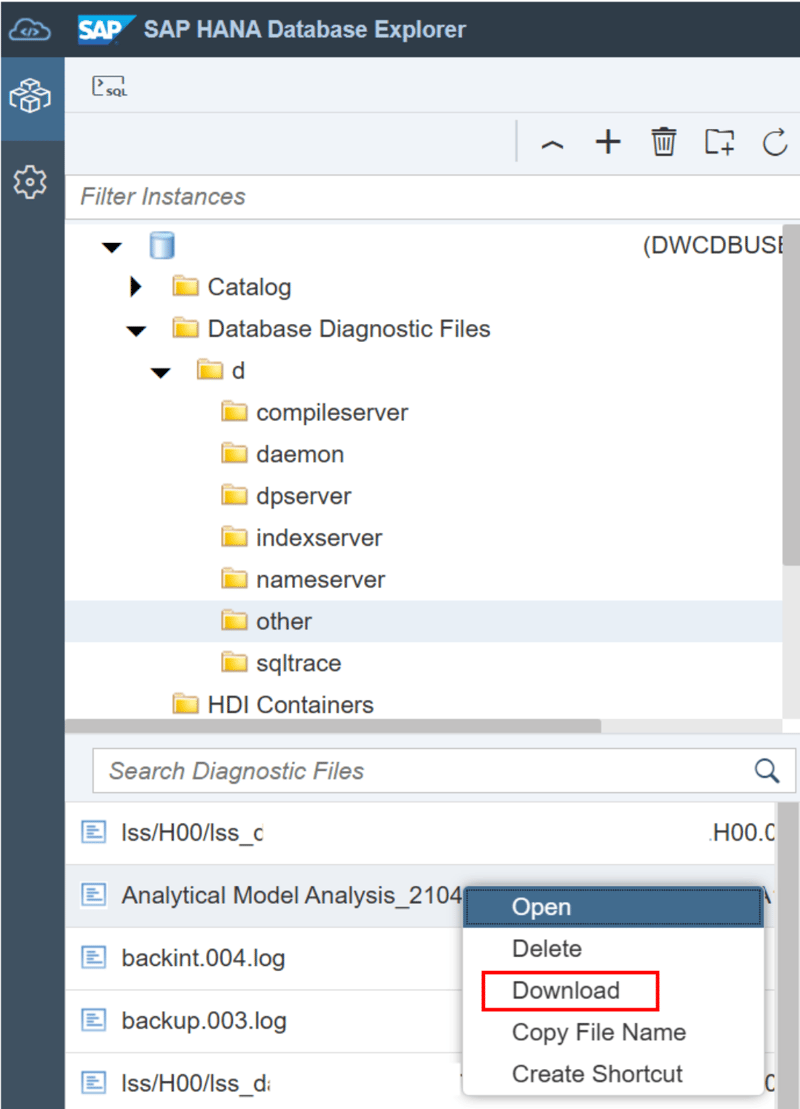
Now switch to the folder Database Diagnostic Files and then other. You can use the search function to look for the generated file. Then right-click and select Download to download the file.
Analyze the PlanViz File
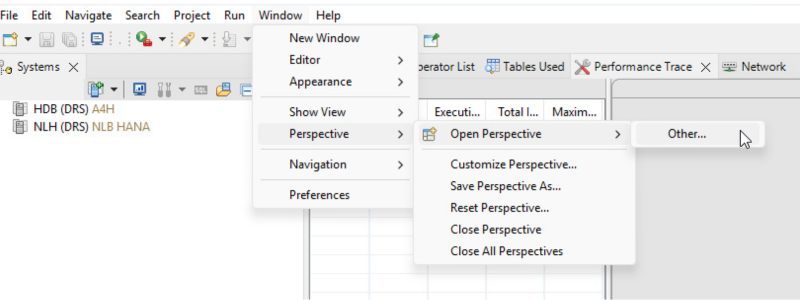
The analysis of the file can be performed in Eclipse using SAP HANA PlanViz. Alternatively, the extension SQL Analyzer Tool for SAP HANA is available for you in Visual Studio Code. Open Eclipse and follow the menu path Window → Perspective → Open Perspective → Other.
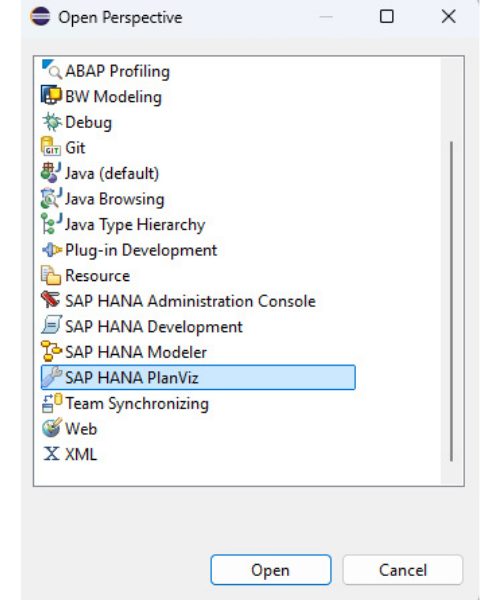
Then select the entry SAP HANA PlanViz and confirm your selection with Open.
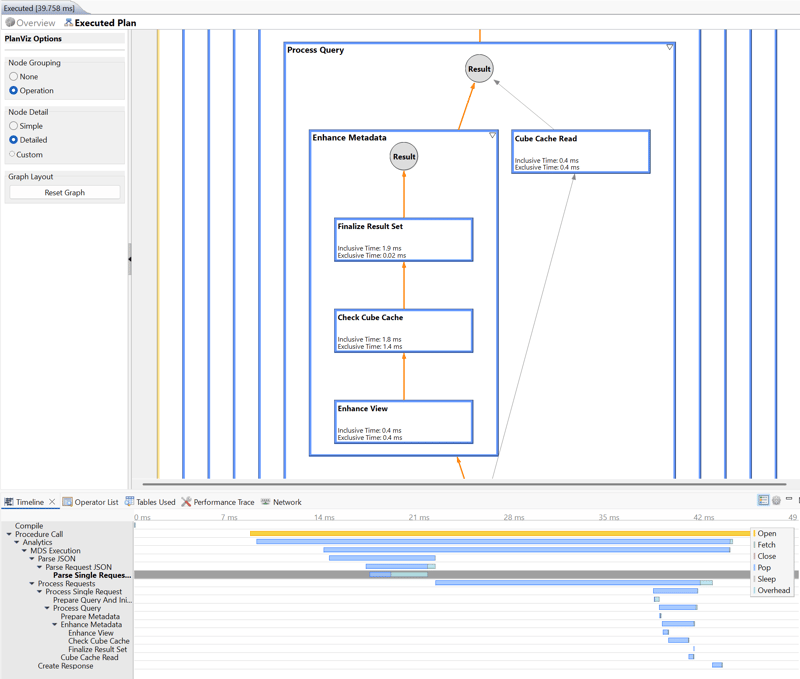
Then open the downloaded file via File → Open File. The overview shows you the runtime and the operators used at a glance. If you want to dive deeper, the Executed Plan view provides you with detailed information on the individual execution steps. Here, the operations performed and their respective duration can be easily traced using the graphical interface.
Further Resources for SAP Datasphere Performance Analysis
We have explained working with PlanViz in detail in the post SQL Performance Analysis with SAP PlanViz. The analysis of the views used in analytical models is covered in the post Optimize SAP Datasphere Views-Visual Performance Analysis with PlanViz. Check it out!
PlanViz for Analytical Models in SAP Datasphere: Our Summary
Even though generating PlanViz files for Analytical Models in SAP Datasphere is not possible directly via the user interface, you can quickly achieve your goal using developer tools and the HANA Database Explorer. This provides you with a detailed insight into the execution of your queries. On this basis, you can analyse performance issues in a targeted manner, pinpoint the causes of slow-running reports and subsequently optimise your analytical models effectively.
If you need support analyzing complex PlanViz files or optimizing slow-performing analytical models in SAP Datasphere, reach out to our experts. Whether you're troubleshooting a specific issue or looking to optimize your overall SAP Datasphere landscape, we can help you achieve measurable performance gains.