Skip to content
NextLytics
Megamenü_2023_Über-uns

Shaping Business Intelligence

Whether clever add-on products for SAP BI, development of meaningful dashboards or implementation of AI-based applications - we shape the future of Business Intelligence together with you. 

Megamenü_2023_Über-uns_1

About us

As a partner with deep process know-how, knowledge of the latest SAP technologies as well as high social competence and many years of project experience, we shape the future of Business Intelligence in your company too.

Megamenü_2023_Methodik

Our Methodology

The mixture of classic waterfall model and agile methodology guarantees our projects a high level of efficiency and satisfaction on both sides. Learn more about our project approach.

Products
Megamenü_2023_NextTables

NextTables

Edit data in SAP BW out of the box: NextTables makes editing tables easier, faster and more intuitive, whether you use SAP BW on HANA, SAP S/4HANA or SAP BW 4/HANA.

Megamenü_2023_Connector

NextLytics Connectors

The increasing automation of processes requires the connectivity of IT systems. NextLytics Connectors allow you to connect your SAP ecosystem with various open-source technologies.

IT-Services
Megamenü_2023_Data-Science

Data Science & Engineering

Ready for the future? As a strong partner, we will support you in the design, implementation and optimization of your AI application.

Megamenü_2023_Planning

SAP Planning

We design new planning applications using SAP BPC Embedded, IP or SAC Planning which create added value for your company.

Megamenü_2023_Dashboarding

Business Intelligence

We help you with our expertise to create meaningful dashboards based on Tableau, Power BI, SAP Analytics Cloud or SAP Lumira. 

Megamenü_2023_Data-Warehouse-1

SAP Data Warehouse

Are you planning a migration to SAP HANA? We show you the challenges and which advantages a migration provides.

Business Analytics
Megamenü_2023_Procurement

Procurement Analytics

Transparent and valid figures are important, especially in companies with a decentralized structure. SAP Procurement Analytics allows you to evaluate SAP ERP data in SAP BI.

Megamenü_2023_Reporting

SAP HR Reporting & Analytics

With our standard model for reporting from SAP HCM with SAP BW, you accelerate business activities and make data from various systems available centrally and validly.

Megamenü_2023_Dataquality

Data Quality Management

In times of Big Data and IoT, maintaining high data quality is of the utmost importance. With our Data Quality Management (DQM) solution, you always keep the overview.

Career
Megamenü_2023_Karriere-2b

Working at NextLytics

If you would like to work with pleasure and don't want to miss out on your professional and personal development, we are the right choice for you!

Megamenü_2023_Karriere-1

Senior

Time for a change? Take your next professional step and work with us to shape innovation and growth in an exciting business environment!

Megamenü_2023_Karriere-5

Junior

Enough of grey theory - time to get to know the colourful reality! Start your working life with us and enjoy your work with interesting projects.

Megamenü_2023_Karriere-4-1

Students

You don't just want to study theory, but also want to experience it in practice? Check out theory and practice with us and experience where the differences are made.

Megamenü_2023_Karriere-3

Jobs

You can find all open vacancies here. Look around and submit your application - we look forward to it! If there is no matching position, please send us your unsolicited application.

Blog
NextLytics Newsletter Teaser
Sign up now for our monthly newsletter!
Sign up for newsletter
 

Optimize SAP Datasphere Views: Visual Performance Analysis with PlanViz

Optimizing view performance is often a tricky business. As data models become increasingly complex, it becomes more and more difficult to keep track of the efficiency of all the views involved. This is exactly where the new SAP Datasphere function for runtime metrics, which we will introduce in this article, comes in.

We will show you how you can effectively monitor the performance of your views and keep an eye on critical metrics such as runtime, memory consumption, and the number of processed data records. You will also learn how to create PlanViz files for visual evaluation. This allows you to detect performance problems early on and identify optimization potential.

Our blog series "SQLScript Performance Analysis" at a glance:

1. Performance analysis and optimization of SAP SQL
2. SQL performance analysis with SAP PlanViz 
3. How to improve the performance of your SQL functions
4. Performance Analysis for SAP Datasphere Transformation Flows
5. Optimize SAP Datasphere Views: Visual Performance Analysis with PlanViz


Runtime analysis in Data Builder

Earlier this year, SAP released a new feature with the Runtime Metrics, which is available in Data Builder under Tools.

This allows you to start the analysis directly during the implementation of the view.


SAP_Dataspehre_Performance_Views_PlanViz_1


The Execute entry starts the run and displays a summary of the results. In addition, the delta between the runs is displayed. This allows you to immediately see the effects of your changes.


SAP_Dataspehre_Performance_Views_PlanViz_2


The Generate Explain Plan option works in the same way as the EXPLAIN command in SQL. Here you can gain insights into the operators and execution engine.

Please note that switching between different engines in the middle of execution has a particularly negative effect on performance. With the Download entry, you can also save the information in the form of a CSV file.


SAP_Dataspehre_Performance_Views_PlanViz_3


Watch the recording of our webinar: 

"SAP Datasphere and the Databricks Lakehouse Approach"

Webinar Recording SAP Datasphere Insights and the Databricks Lakehouse Approach    View recording  


Analyzing nested views

For nested views that in turn use other views, you can use the Impact and Lineage Analysis to perform performance analysis for individual views.


SAP_Dataspehre_Performance_Views_PlanViz_4


To do this, select the respective view and choose Runtime Metrics in the dialog. Here you can perform the analysis as usual.


SAP_Dataspehre_Performance_Views_PlanViz_5


Generate PlanViz file

Similar to transformation flows, PlanViz files can also be created for views for visual evaluation. To do this, select the Open View Analyzer entry in the Runtime Metrics dialog.


SAP_Dataspehre_Performance_Views_PlanViz_6


Then select the Generate Plan File for SQL Analyzer entry in the View Analyzer settings and click Start. You will now be redirected to the Data Integration Monitor. Here you can download the PlanViz file (*.plv).

SAP_Dataspehre_Performance_Views_PlanViz_7


The file can be evaluated in Eclipse using SAP HANA PlanViz. Alternatively, the SQL Analyzer Tool for SAP HANA extension is available in Visual Studio Code.

Open Eclipse and follow the menu path Window → Perspective → Open Perspective → Other.


SAP_Dataspehre_Performance_Views_PlanViz_8


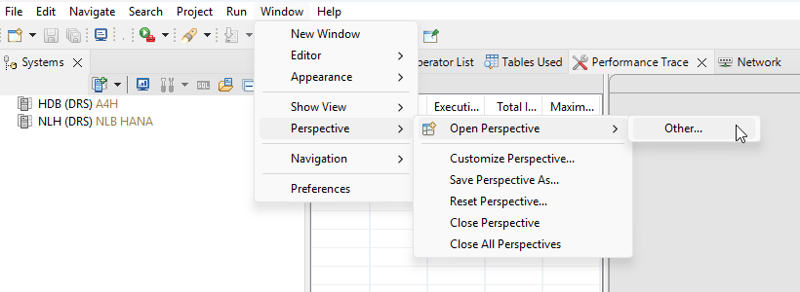
Then select the SAP HANA PlanViz entry and confirm your selection with Open.


SAP_Dataspehre_Performance_Views_PlanViz_9

Then open the downloaded file via File → Open File. The overview shows the runtime, the operators, and the number of tables and data records.


SAP_Dataspehre_Performance_Views_PlanViz_10

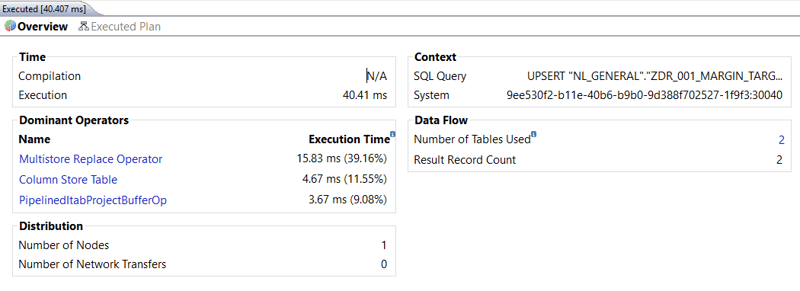
In the Executed Plan view, you will find detailed information about the individual execution steps. There you can see the respective duration, the number of data records, and the operations performed. The visual representation makes analysis much easier.


We have already explained these details in detail in our article “Performance Analysis for SAP Datasphere Transformation Flows” in the tabs Timeline, Operator List, Tables Used, and Performance Trace. Take a look!

Visual Performance Analysis with PlanViz for SAP Datasphere Views: Our Conclusion


The new runtime metrics for SAP Datasphere Views greatly simplify performance analysis. Developers receive meaningful key figures directly in Data Builder, enabling them to identify bottlenecks more quickly and remedy them in a targeted manner.

The ability to examine nested views in detail and perform a visual evaluation using PlanViz is particularly helpful. This allows optimization potential to be identified at an early stage, which not only makes the work of developers easier, but also ultimately impresses users with more stable and faster applications.

Do you have questions about SAP Datasphere Views another topic? Just get in touch with us – we look forward to hearing from you!


Learn more about  SAP Datasphere


FAQ

What are runtime metrics in SAP Datasphere?

Runtime metrics are a feature in SAP Datasphere that allows developers to monitor the performance of views. They provide insights into key metrics like runtime, memory usage, and the number of processed data records, helping to identify bottlenecks and optimization opportunities.

How can I create PlanViz files for visual performance evaluation?

To create PlanViz files, open the View Analyzer in the Runtime Metrics dialog and select "Generate Plan File for SQL Analyzer." You can then download the file from the Data Integration Monitor and analyze it in Eclipse or Visual Studio Code using SAP HANA PlanViz.

What is the benefit of analyzing nested views?

 Impact and Lineage Analysis allows you to perform detailed performance analysis on nested views. This is particularly useful when one view depends on others, and a deeper analysis is required to optimize performance.

How can I monitor the performance of my views during implementation?

In Data Builder, you can monitor performance during the implementation by using the runtime metrics. The "Execute" function starts the analysis and shows the results along with delta values between runs.

,

avatar

Dimitrios

Dimitrios has been working with Native HANA and SAP products since January 2020, and he joined NextLytics as an SAP consultant in early 2022. Thus, he has already gained a lot of hands-on experience with SAP Datasphere. In his free time, he enjoys hiking, watching movies and spending time with friends.

Got a question about this blog?
Ask Dimitrios

Optimize SAP Datasphere Views: Visual Performance Analysis with PlanViz
3:50

Blog - NextLytics AG 

Welcome to our blog. In this section we regularly report on news and background information on topics such as SAP Business Intelligence (BI), SAP Dashboarding with Lumira Designer or SAP Analytics Cloud, Machine Learning with SAP BW, Data Science and Planning with SAP Business Planning and Consolidation (BPC), SAP Integrated Planning (IP) and SAC Planning and much more.

Subscribe to our newsletter

Related Posts

Recent Posts