/Logo%202023%20final%20dunkelgrau.png?width=221&height=97&name=Logo%202023%20final%20dunkelgrau.png)


The holiday season is over and while some of our colleagues are still busy with the end of year closing tasks, others are back from their winter vacation. Whether this blog article is read as a little breather or a light start after the vacations, it doesn't matter. Grab a hot or cold beverage of your choice, it's time for the NextLytics wish list to SAC for 2023!
Story and Story...
... but why is Analytics Designer missing from the headline? The Analytics Designer and Story have been aligned and enhanced with useful features in past updates. Anyone who has looked more deeply into the SAC dashboarding capabilities knows how tedious it has become to explain and delineate the use cases of Stories and Analytics Designer, as many features are present in both applications. We wish we don't have to point this out in the near future and SAP will unify the two dashboarding applications, Story and Analytics Designer.
Of course, we heard the rumors and we were already able to test the beta version of Story 2.0 ourselves. The new environment combines the simplicity of Stories and the scripting of Analytics Designer. Currently it is still in the development stage and some features are missing or not fully operational. Nevertheless, the first impression is promising and we hope that this great innovation will be available for all users in 2023.
You know what's better than adding missing features? Adding these features properly polished! The ability to customize the design and formatting of the dashboard or selected widgets via coding has always been rudimentary. The CSS supported is merely a subset of the CSS3 standard. We would like to see more freedom in CSS!
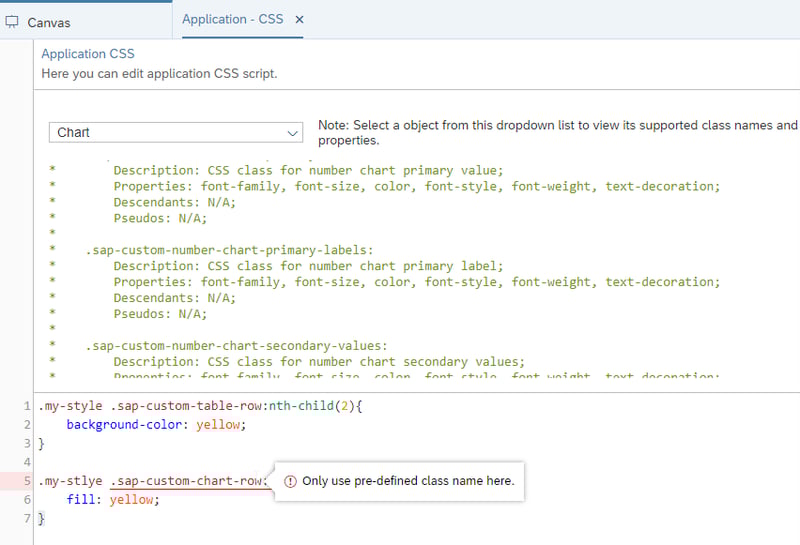
There are many restrictions regarding CSS, for example we still miss the capability to apply CSS to specific data points.
And while we're on the subject of improving features, we'd also like to see numerous tweaks to the input filter widget. We'd love to sort the hit list, put script commands directly on the widget, query all values instead of just all selected values, or just make the display window bigger.
With each selection in the input filter, the linked widgets are immediately adjusted. With larger amounts of data, multiple selections will cause performance issues. Therefore a further improvement would be to be able to operate the selection over an appropriate button, in order to update the linked widgets only once.
Personally, I am not a fan of statements like "everything was better in the old days", but nevertheless we still miss two great Lumira features in SAC. A useful feature in Lumira were composites, which were often unjustly left out, because they bring additional complexity to the dashboard development. In a composite, different elements such as areas, charts, buttons, etc. can be grouped together so that they can later be reused in different dashboards. Composites unify the functions and design of dashboards, and furthermore, adjustments such as a logo swap only have to be made once in the composite.

Composites make it possible to define headers as a separate, reusable component, including navigation, filters and export functions.
Even though composites were on our wish list last year, we're not giving up hope that they'll find their way into SAC this year.
A bit more abstract is the wish for a DataContainer feature. Basically, every widget in a dashboard is assigned to a data model. But what if there was a DataContainer widget that was only used to provide data and pass it to tables, charts, or text?
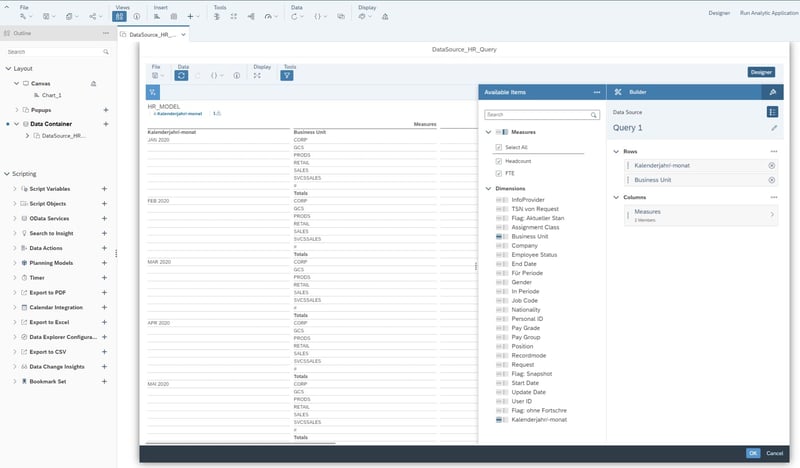
The DataContainer feature in Analytics Designer: Unfortunately only an image montage by us and so far not present in SAC.
Dashboarding with SAP Analytics Cloud -
Download the whitepaper here!

For example, let's look at the numeric point chart used to display metrics by amount. The widget offers little freedom and the performance is slow if you want to display multiple values in separate widgets. Each widget sends its own query to the data source. The common workaround is to recreate the widget using text fields and script. To do this, create an invisible table or chart widget with the metrics to be displayed. Using the ResultSet of the widget, the appropriate key figure values are selected via script and written into the text fields. This increases the performance enormously and often leads to a better design. Unfortunately, the workaround is quite tedious and confusing. A DataContainer, which visualizes the ResultSet as a table, would remedy the situation! This way a query or view could be connected to the container and then fill the widgets via databinding.
Planning
In the area of planning, a lot has been done in the last year and we are confident that also this year many features for planning and forecast scenarios will appear. Nevertheless, we have a few specific wishes here as well.
Especially in the planning the comment function is very important and could be improved a bit. It would be extremely helpful to be able to individually define tables which allow comments. We would also appreciate it, if comments could be created on data points within live SAP BW data models.
Of course, we are always happy to hear about API enhancements or new formulas as well. Multi Actions were a big improvement last year, but unfortunately there is no way to address them via the script in a story or application. With the right API, Multi Actions could be built into stories much more flexibly to cover different scenarios.
The formula editor in the Modeler could also be extended, for example with a year-over-year formula.
Connectivity
The DWC and SAC continue to grow together and this integration continues to bring new features to light. For example, DWC data models are integrated directly into the dashboard without having to create a model or live connection in SAC. While in the ideal SAP world every customer switches to DWC or uses at least one SAP BW as a substructure, the reality on the customer side looks differently. The system world is heterogeneous and the need to process data in reporting that does not originate from BW or DWC still exists. In order to not always have to rely on a SAC data model and to persist data unnecessarily in the SAC, we would like to see more live connections. The undisputed leader here is the SQL live connection, which can cover a large number of use cases and would certainly make many IT departments happy.
We would also be happy if the feature list for the existing Connections was a bit more consistent. For example, hierarchies cannot be provided across BO universes. Linked Dimensions work wonderfully between Live Queries, but only to a limited extent as soon as Excel data is additionally linked. Likewise, some features remain reserved for only some connection types, such as Live Queries.
SAP Analytics Cloud Features - Our Summary
A lot has happened in SAC in the past year. Existing features have been enhanced and new ones added. Our wish list is still quite long and shows the potential we see in SAC. For customers who use SAP BW or DWC, we can recommend SAC without reservation.
With this wish list, we just wanted to get some functions off our chest that we miss in our daily work with SAC. Unfortunately, not all of our wishes for the SAC were implemented last year. However we are pleased with the progress and are excited about the possible progress in 2023.
Do you have questions about this or other topics? Are you trying to build up the necessary know-how in your department or do you need support with a specific issue? We will be happy to help you. Request a non-binding consulting offer today.