/Logo%202023%20final%20dunkelgrau.png?width=221&height=97&name=Logo%202023%20final%20dunkelgrau.png)


In this article we would like to introduce you to the most interesting new features of the current Q4 2019 release of SAP Analytics Cloud. If you compare the number of new features with the last releases, you will notice that a lot of new features have been added in Q4 2019. A special innovation is the SDK for the Analytics Designer. We have summarized the most interesting new features for you:
Analytics Designer
- Tab Strip for all users: The Tab Strip from the Bi-Weekly Release 2019.16 (we reported) is now also available for all users. This new feature allows multi-page dashboards.
- Lazy loading for hidden charts (BETA): From now on charts can only be initialized as soon as they are visible. This feature is only available for BETA users.
- Bookmarks: The developer can define what to save in Analytics Designer. Unlike stories, bookmarks are stored in the file repository and not in the dashboard. But it is not possible to load bookmarks directly in the Analytic Application.
- Timer: Scripts can now be executed with a time delay.
- Widget size: Widgets can now be dynamically adjusted to different screen sizes.
- AD Export: Export as PDF for "standard widgets" (no SDK widgets and R-visualizations).
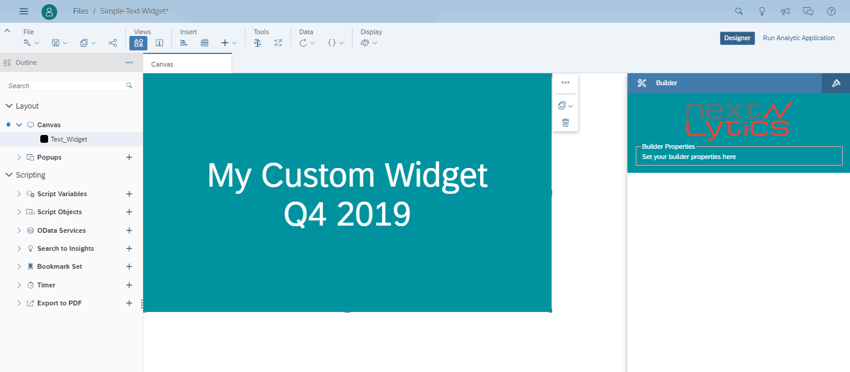
- SDK: This is probably the most interesting new feature. From now on you can develop your own widgets, which are then available in the Analytics Designer. The widgets are created using JavaScript, hosted on an own web server and imported into SAC with a JSON file (metadata for the widget).
- Arrangement of widgets: The position of several widgets can now be adjusted simultaneously. This simplifies the design process.
Dashboarding with SAP Analytics Cloud -
Download the whitepaper here!
Data Visualization
- Improved comparisons in charts: In the Builder panel, comparisons are suggested by the system. These are based on time and version.
- Linked Analysis now also for hierarchies: If charts are in the same hierarchies, they can be linked to other charts.
- Dynamic time filter: Now it is possible to filter previous values (Day, Week, Month, Year etc.).
Modeling, Smart Assist
A translation can now be added to the models, which is automatically translated by a service.
With Smart Insights, changes over time can now be displayed graphically as well as textually in the designer panel.
Conclusion
As in the last releases, SAC continues to pick up speed. Particularly the new functions for the Analytics Designer stand out. The SDK widget now also allows the development of own widgets, so that the widgets can be created individually to own requirements. As always, we will keep you up to date on further developments and releases in our blog.