





















The end of the year is approaching, Advent is just around the corner, and SAP is rolling out one final update with its QRC4 release. While there are no major surprises, the last update of the year brings numerous smaller improvements to SAP Analytics Cloud. Planning, in particular, sees several enhancements: New features simplify data entry and reallocations, while updates to Data Actions and Advanced Formulas provide greater flexibility.
The new Table Build Experience continues to evolve, offering additional options for filtering and customizing tables. In contrast, AI developments are somewhat limited. The much-anticipated AI agents are still nowhere to be seen, although the Prompt Insights Widget has become significantly more useful. Seamless Planning also takes another step forward, further improving integration between SAP Analytics Cloud and SAP Datasphere.
We've explored the most important new features, tested some of them ourselves, and highlight what delivers practical value and where SAP still has room for improvement.
What's New for Planning in SAP Analytics Cloud QRC4?
Adding new dimension combinations from Excel to an SAC planning table used to be a tedious process. Each row had to be created manually, dimension members selected individually, and values entered afterward. The new Add Member Combinations feature makes this much easier. From a table row's context menu, users can add either one empty row (Add Member) or five empty rows (Add Member Combinations). They can then simply copy and paste dimension combinations and values from Excel. SAC automatically checks the entries against the master data and flags any invalid values. Clicking Process Data applies the changes, while Exit discards them.
Another useful addition is Repost Data, which makes reallocating existing planning values much simpler. It allows users to move values directly to a new, previously unused dimension combination. For example, when introducing a new cost center, existing planning values can be transferred without having to create new entries, publish them, and manually delete the old ones. This also reduces the risk of duplicate planning figures caused by forgotten deletions. With Repost Data, everything happens in one step. The feature can be enabled by selecting Repost under Planning in the table's Builder panel.
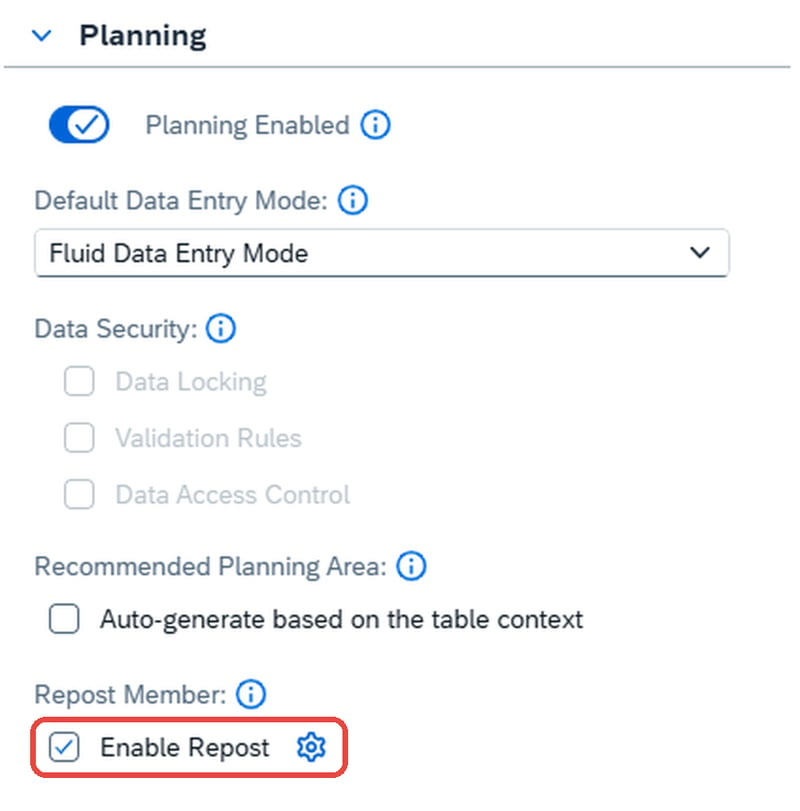 Repost Data is enabled in the table's Builder panel under Planning
These features are complemented by several smaller improvements to data entry. When pasting values from Excel, SAC now automatically takes the scaling of the target cell into account. With the batch interval reduced to 50 milliseconds, inputs are processed almost instantly. SAC also displays a warning when users attempt to close the browser tab while unpublished data is still present.
Add Member and Repost Data are well implemented, particularly because SAC provides helpful validations. When inserting data, invalid master data entries and empty rows are highlighted. When reposting values, SAC warns users if the target dimension combination already exists. Nevertheless, it raises the question of why these features are only being introduced now and why Add Member is limited to just one or five rows.
Additionally, Repost Data is only available in the cross-tab layout, not in the forecast layout.
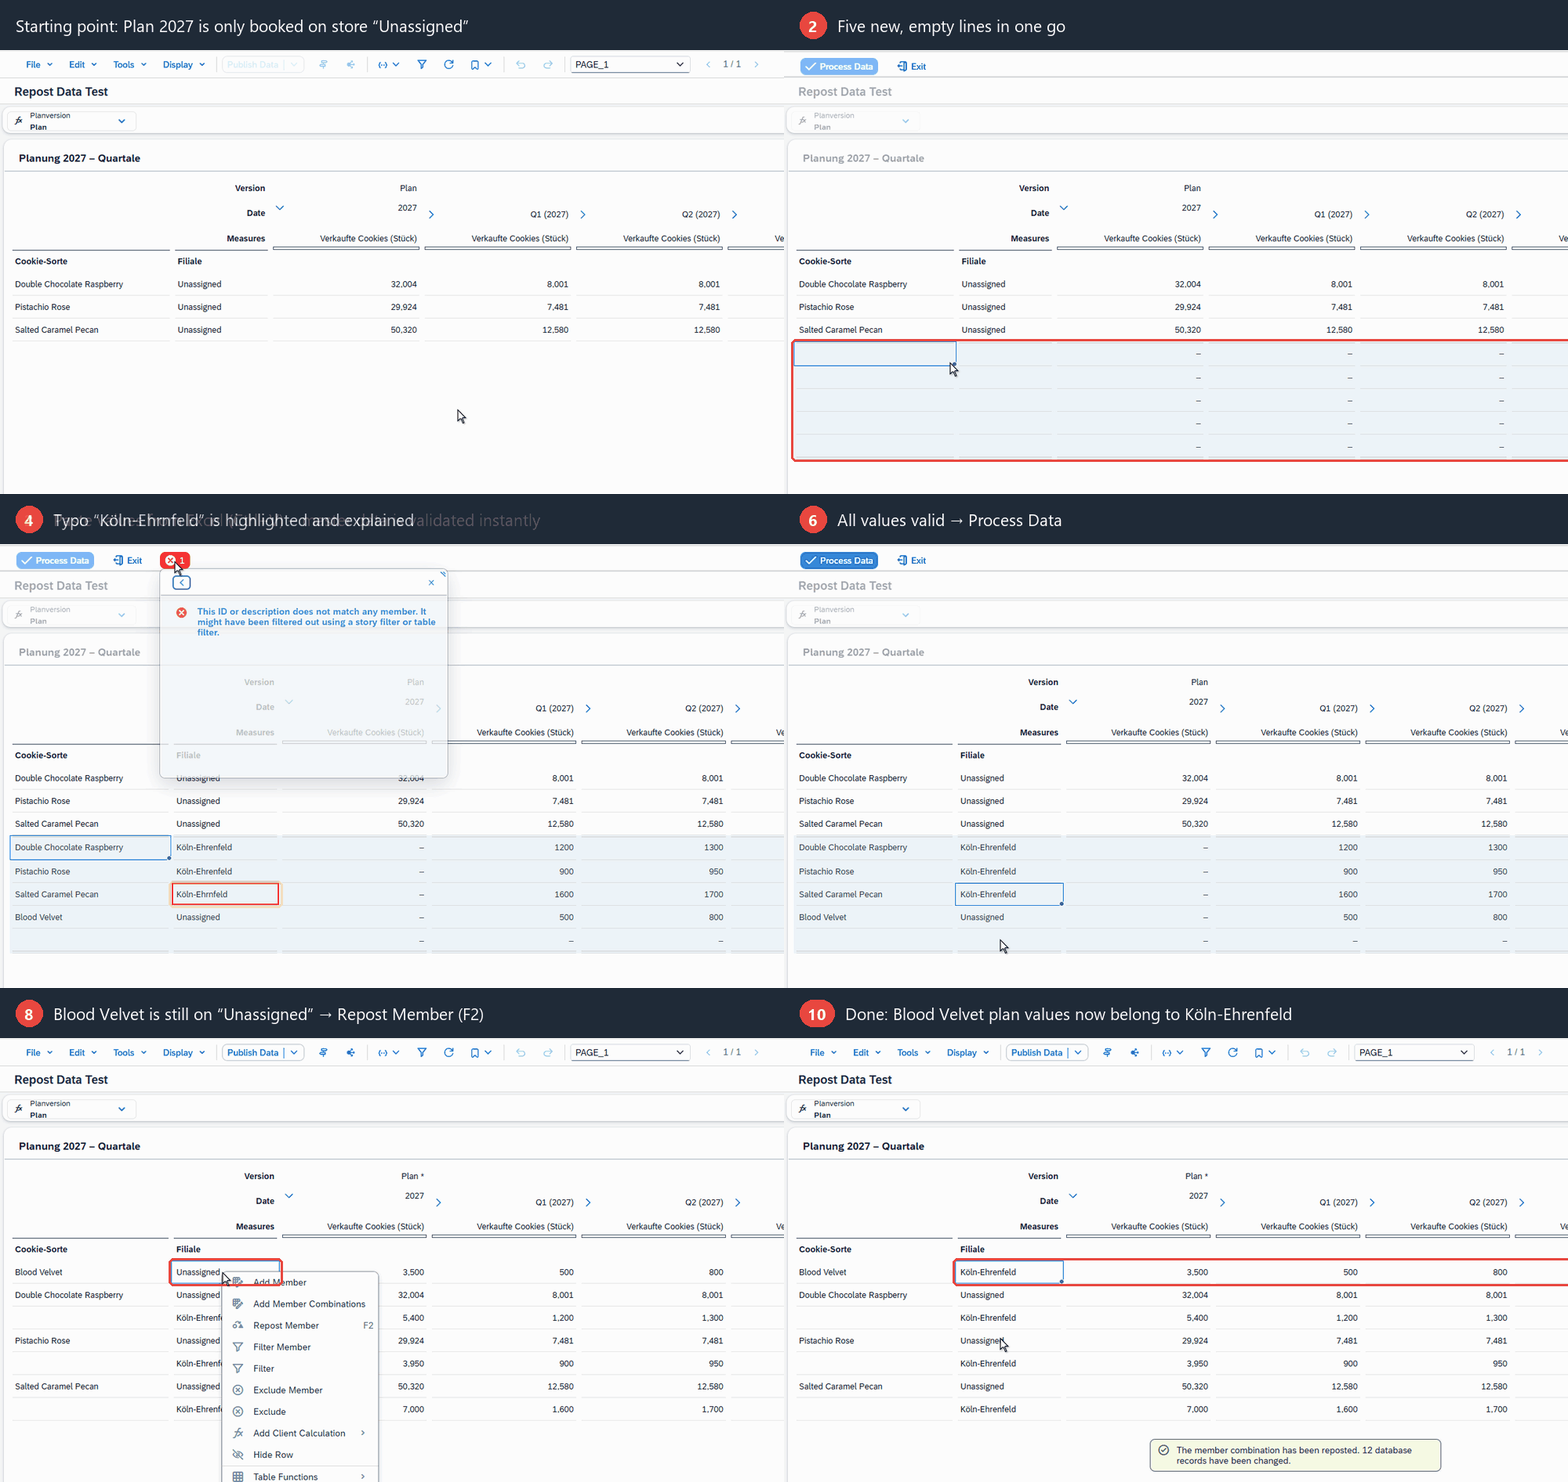 Add Member Combinations and Repost Data in a planning table
How Does Seamless Planning Bring SAC and SAP Datasphere Closer?
Bringing the Version Dimension to Datasphere
With the Q4 release, the integration between SAP Analytics Cloud and SAP Datasphere is further enhanced as part of Seamless Planning. The version dimension of a planning model can now be shared with SAP Datasphere and used in additional data models.
From Datasphere: Task Chains Load Data Directly into Planning Models
One of the most interesting Seamless Planning updates actually comes from SAP Datasphere rather than SAC itself. A new operator for Task Chains is set to make it possible to load data directly into Seamless Planning models and their dimension tables. According to SAP's release schedule, the Datasphere rollout starts on November 18, with the corresponding SAC functionality expected to arrive on November 28.
This means planning data loads could become part of a broader Datasphere Task Chain, alongside other data integration processes. For example, a workflow could update master data, load actuals, generate a forecast in SAP Databricks, and write the results directly into a forecast version. Task Chains can run on a schedule or be started manually. SAP also states that the new operator should replace most of the OData connections previously needed to load master and transactional data into Seamless Planning models. Hierarchies are supported as well.
There are a few requirements and limitations to keep in mind. The planning model and Task Chain must be located in the same Datasphere space, and SAC and Datasphere need to be connected through a formation rather than the older tenant connection. Validation rules are not checked during imports, changes do not appear in the SAC audit log, and data access permissions cannot be transferred. Starting a Task Chain from an SAC Multi Action is not supported yet either.
If the new operator delivers on these capabilities, it could significantly reduce the need for separate interfaces in Seamless Planning. We're looking forward to testing the feature ourselves and seeing how it performs in practice.
What Changes for Data Actions, Advanced Formulas, and Multi Actions?
We already covered the Data Filter Parameter in our QRC3 release blog post, highlighting it as a useful addition. With Q4, SAP makes it even more convenient: A new option automatically carries the parameter over to every new step added to a Data Action.
What caught our attention even more, though, are the new string functions in Advanced Formulas. Until now, working with strings in Advanced Formulas has been surprisingly limited. The introduction of CONCAT, LEFT, RIGHT, and SUBSTR finally makes it possible to combine strings and extract specific parts of them. For a scripting language that regularly deals with member IDs, these feel like long-overdue basics.
To see how much of a difference they make, we tested them in a practical scenario. We wanted to apply seasonal factors across several stores in a city: a 20% increase in December and a 10% reduction in July and August. Store IDs combine the city and district (e.g., KOE_EHR), while periods use the YYYYMM format. We implemented the same logic twice: once using the previous syntax and once with the new string functions.
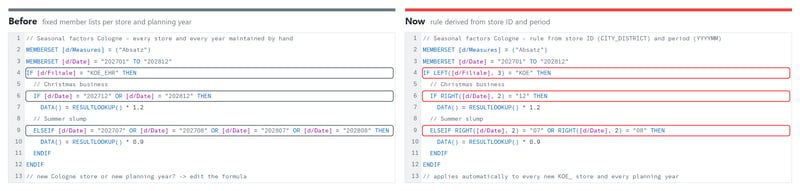 Seasonal factors in Advanced Formulas: fixed member lists before, string functions now
The real benefit of the new string functions is their flexibility. Until now, every store and period had to be explicitly defined in the formula. Adding a new store or extending the planning horizon meant updating the script. With LEFT and RIGHT, a few general rules can now do the job: LEFT([d/Filiale], 3) = "KOE" automatically includes all stores in Cologne, while RIGHT([d/Date], 2) = "12" covers every December, regardless of the year. The same formula works across any number of stores and planning years, without the need for additional member properties to identify cities or seasonal periods.
There is one catch, though: If a constructed member ID doesn't exist, SAC won't flag it as an error, either during validation or execution. Instead, the values are simply not written. This means mistakes in naming conventions can easily slip through unnoticed.
SAP also mentions performance improvements for Advanced Formulas, although it hasn't shared any specifics about what has actually changed.
New Engine for Data Actions (Data Action Engine Mode)
SAP is introducing a new Optimized engine for Data Actions, promising faster execution, especially for more complex and time-consuming calculations. Users can choose between three settings: Automatic, where SAP handles the switch, Optimized for the new engine, and Legacy for the previous one. However, SAP hasn't shared any concrete performance figures.
So, does the new engine actually make a difference? We put it to the test in our own tenant. One interesting observation right from the start: With the setting on Automatic, SAP had already switched to Optimized without us having to do anything.
We then ran two Data Actions on a model with around 244,000 records: a straightforward data copy and a more complex calculation. Each action was executed three times with each engine.
The result? No noticeable difference. Both engines returned identical results and completed their runs in 1 to 2.5 seconds. Most of that time was spent preparing the execution rather than running the calculations themselves.
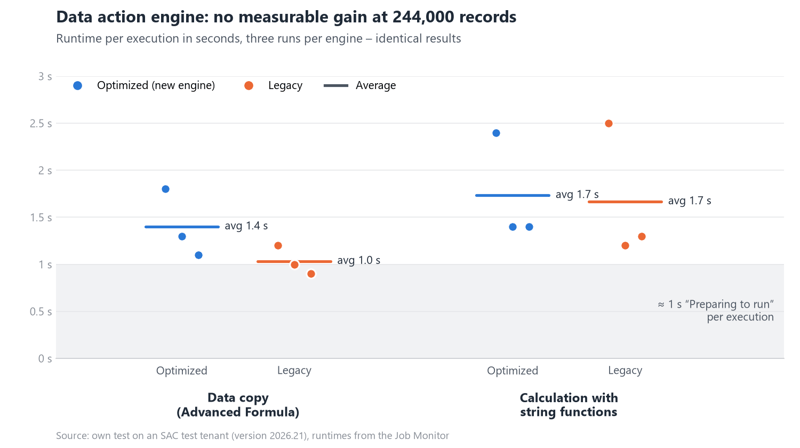 Runtimes of the Optimized and Legacy Data Action engines in our test
We were therefore unable to determine whether the new engine provides performance benefits for Data Actions with execution times of several minutes. It is also worth noting that the Job Monitor does not indicate which engine was used. This information can only be checked in the system configuration.
Multi Actions
Story filters and input controls can now be linked directly to parameters of Multi Action script objects using the APIs bindInputControl and getBoundInputControl. In addition, users can skip non-mandatory validations in the Multi Action Starter, although SAP recommends this only for Multi Actions that have already been tested and are considered trustworthy.
The master data import process has also been simplified: The desired public dimension can now be selected directly in the import step without having to select a model first.
Download our whitepaper - Dashboarding with SAP Analytics Cloud
When Should You Switch to the New Table Build Experience?
With Q4, SAP makes its direction clear: The old table-building experience is being phased out, and all future enhancements will focus exclusively on the new Table Build Experience. There's no official end date yet, but following the deprecation of Classic Stories in Q3, this is the next step in SAP's transition. If your organization relies on a large number of tables, it's worth planning the migration sooner rather than later.
For us, the biggest improvement is the new condition-based filtering. It works wherever filters can be applied, including tables, story filters, and input controls. Alongside familiar options like "greater than", "less than", and "between", users can now filter text using conditions such as "contains", "starts with", and "ends with". In tables, simply right-click a dimension header to access the feature. In our tests, text filters searched member descriptions and ignored capitalization. The classic member filter is also accessible from the context menu and now supports searching and selecting multiple members. One limitation remains, though: You can't use both filter types on the same dimension.
Filters for measures and time periods are still missing from table headers. SAP plans to add these options over the next few quarters.
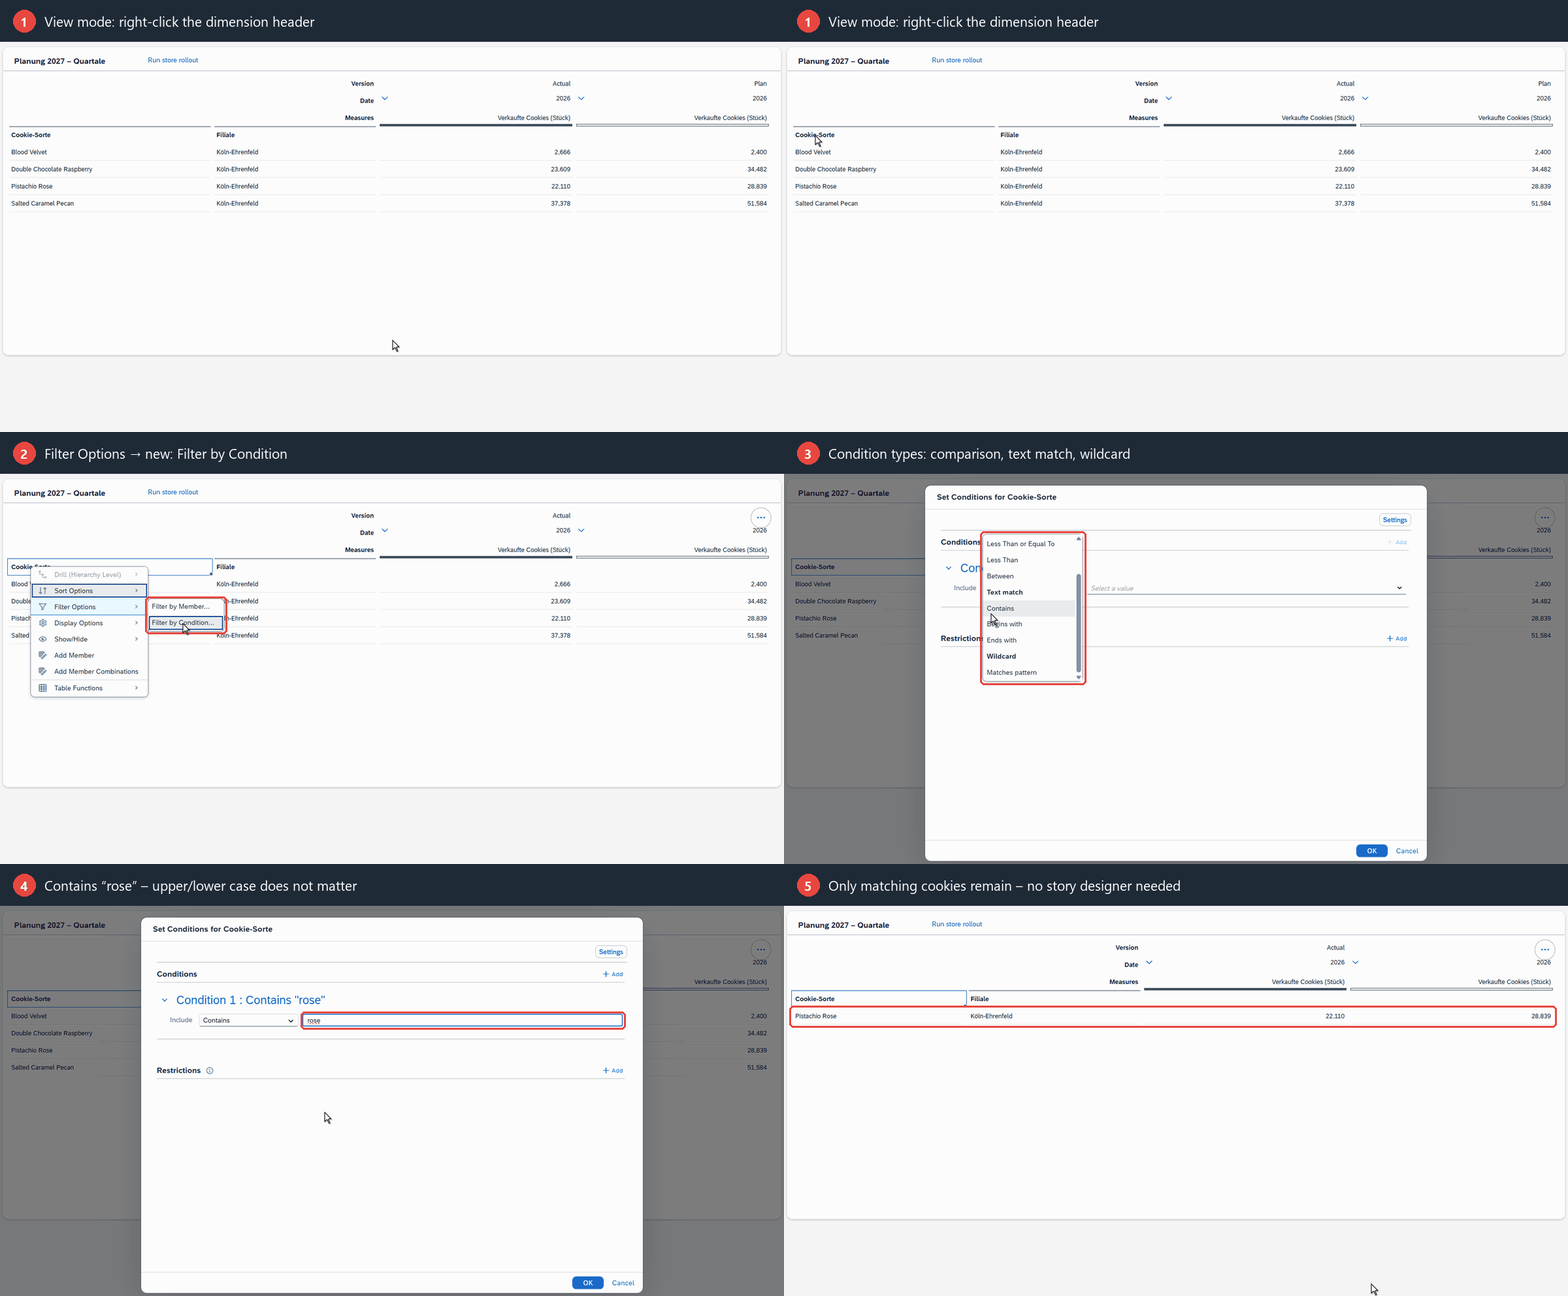 Condition-based filtering in the new Table Build Experience
SAP also gives users more control over how tables are displayed. Consecutive header cells with the same member name can now be merged, while story designers can limit the number of visible rows and columns. New tables automatically get a more meaningful title based on their dimensions and measures, instead of simply showing the model name. For time and date dimensions, it's also possible to display the year or quarter in parentheses.
Organizing dimensions and measures is becoming more convenient, too. In both the Builder and Quick Builder, dimensions can now be moved up or down directly from the context menu.
For SAP BW-based tables, there's an additional improvement: Measures and calculations within the measure structure can now be rearranged using drag-and-drop or inserted exactly where they're needed from the Data Panel. Want to display revenue, costs, and margin in that order? Simply move the measures into place, and the table updates immediately.
Especially for SAP BW customers, this removes another barrier to switching to the new Table Build Experience.
What Does SAC Q4 2026 Deliver for AI and Joule?
According to SAP's roadmap, Q4 was expected to bring significant progress in AI. Several AI agents for modeling, planning, and story creation had been announced, along with substantially enhanced analytical capabilities in Joule. However, very little of this has made it into the current release. Instead, SAP focuses on smaller enhancements to existing features. While less impressive, some of these improvements are immediately usable.
Joule is now also available in the Lite Viewer, and Just Ask offers better support for German-language models. Tables generated through Just Ask queries can now be edited, and My Metrics gains AI-powered trend analysis.
Prompt Insights Gets Its Own Scripting API
The biggest AI improvement in Q4 is the new Scripting API for the Prompt Insights Widget, which SAP first introduced in Q3. In our previous blog post on the Base AI Features, we criticized the fact that the AI could only access data from the linked widget. With Q4, SAP introduces a dedicated Scripting API that overcomes this limitation. The widget can now be connected to multiple tables and charts, even if they are hidden in the story. In our test, for example, the story displayed only annual totals, while the AI also correctly analyzed monthly values from a hidden table.
Story developers can also provide additional context through a hidden prompt of up to 8,000 characters. This could include thresholds, background information, or instructions on how the response should be formatted. In our tests, the AI consistently followed the requested format. The API also allows developers to set the visible prompt, start the AI generation, and retrieve the result as text. There's one catch, though: Story viewers can't edit the prompt directly. To let them enter their own questions, developers need to add a separate input field and pass the text to the widget through scripting.
Another limitation is that the AI analysis doesn't refresh automatically when a story opens or filters change. It needs to be triggered manually, for example, with a button click. Until then, the analysis still reflects the previous data state, although the widget makes this clear. And as with any AI-generated content, the results deserve a second look. In our test, the analysis itself was accurate, but one percentage figure wasn't displayed correctly. Especially for management reports, it's worth checking the output before sharing it.
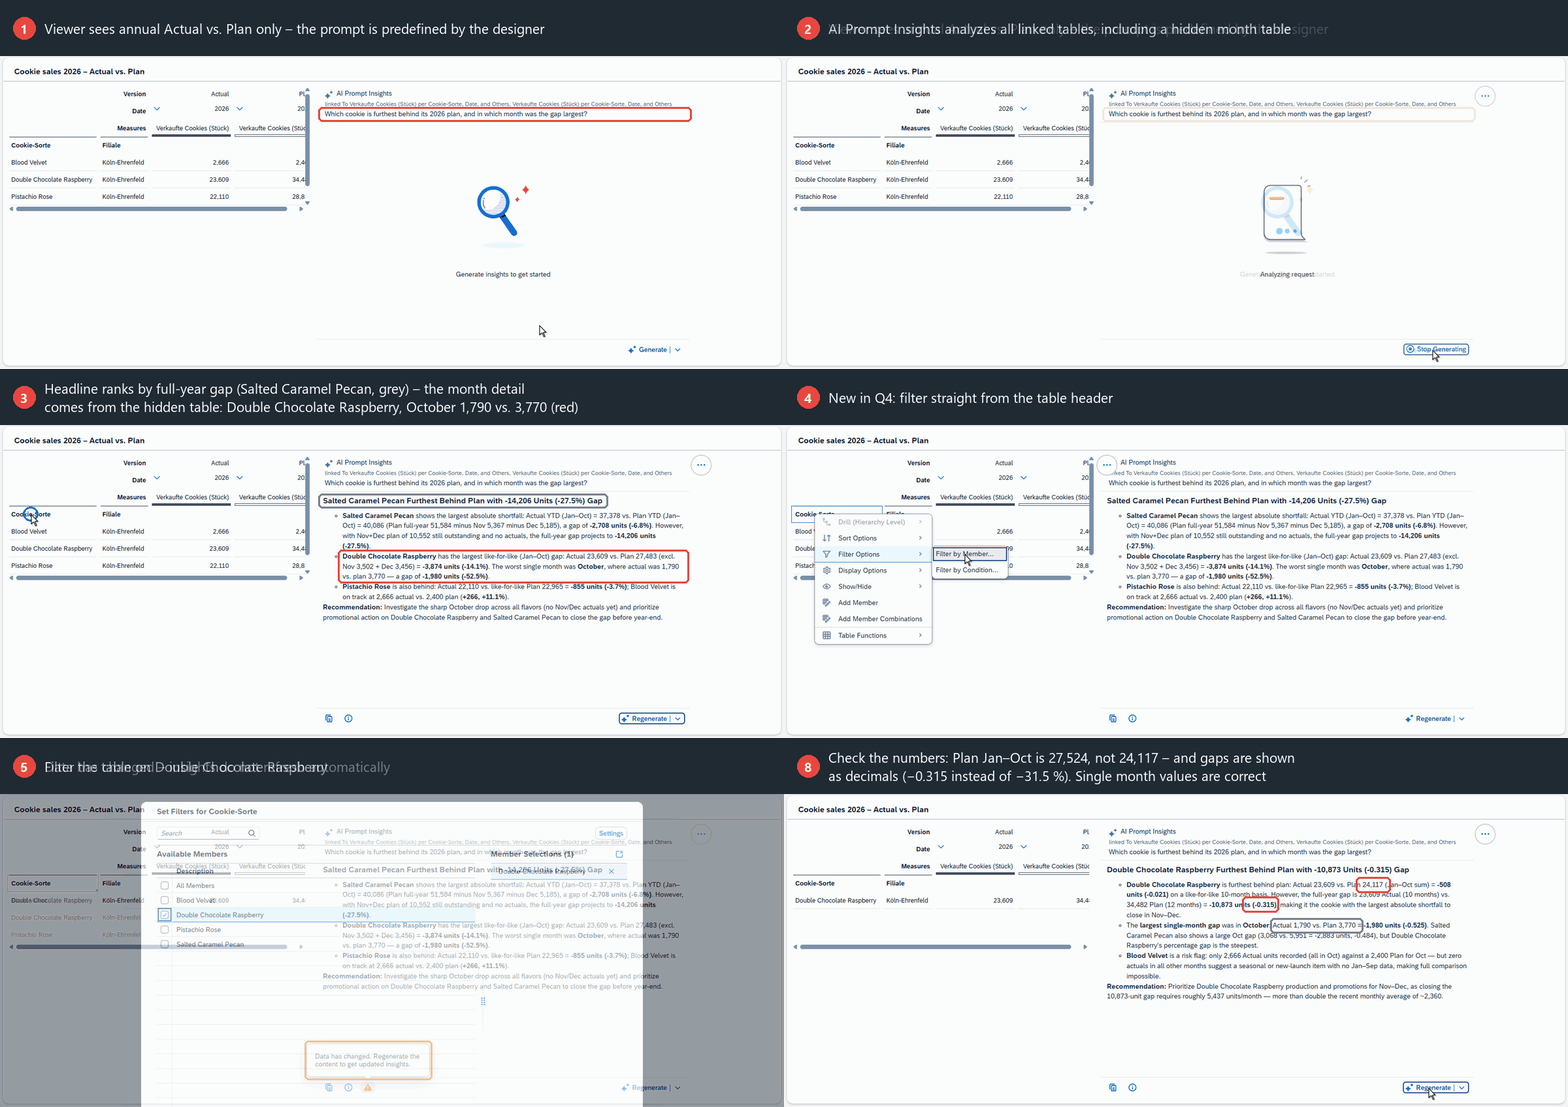 Prompt Insights with the new scripting API
Which Other Improvements Matter for Visualization and Validation?
New Default Theme: Morning Horizon
The most noticeable change in this release affects all users: Morning Horizon (Light) becomes the new default theme unless users have selected a custom appearance. As with the replacement of the old home screen in Q3, we recommend reviewing training materials and screenshots to ensure they reflect the updated interface.
Data Validation Rules: Business Validation Directly in the Model
With the Q4 release, SAP introduces Data Validation Rules, allowing business validation rules to be defined directly in the Modeler. Each rule compares a value against a reference value. For every rule, users can specify whether a violation should be treated as an error or a warning.
The rules are executed through a new validation step in a Data Action. Planners can trigger the validation directly from a story and view the results in the embedded Job Monitor. If publishing a Data Action fails due to a validation rule, the Job Monitor now displays the affected records. Previously, SAC only indicated that some changes could not be published.
This makes it possible to perform plausibility checks directly in SAC, replacing processes that previously often relied on manual Excel checks or custom variance reports.
New Scripting Events for Publishing Versions
SAP is introducing two new scripting events that give story developers more control over version publishing. Until now, there was no way to intercept a click on the standard Publish button. Developers who wanted to run checks before publishing had to create their own button, but users could still bypass it by using the standard one.
This changes with onBeforeVersionPublish. The event runs just before a version is published, and publishing only continues if the script explicitly allows it. Otherwise, SAC stops the process and informs the user. For example, developers can make sure all cost centers have been planned or that an approval has been granted before a version is published.
The second event, onAfterVersionPublish, runs once publishing is complete. It can trigger follow-up actions, such as sending a notification to the controlling team or copying data into another model.
There is one important limitation, though: Both events only apply to stories in View mode. Publishing through Data Actions, Multi Actions, or Joule bypasses these events.
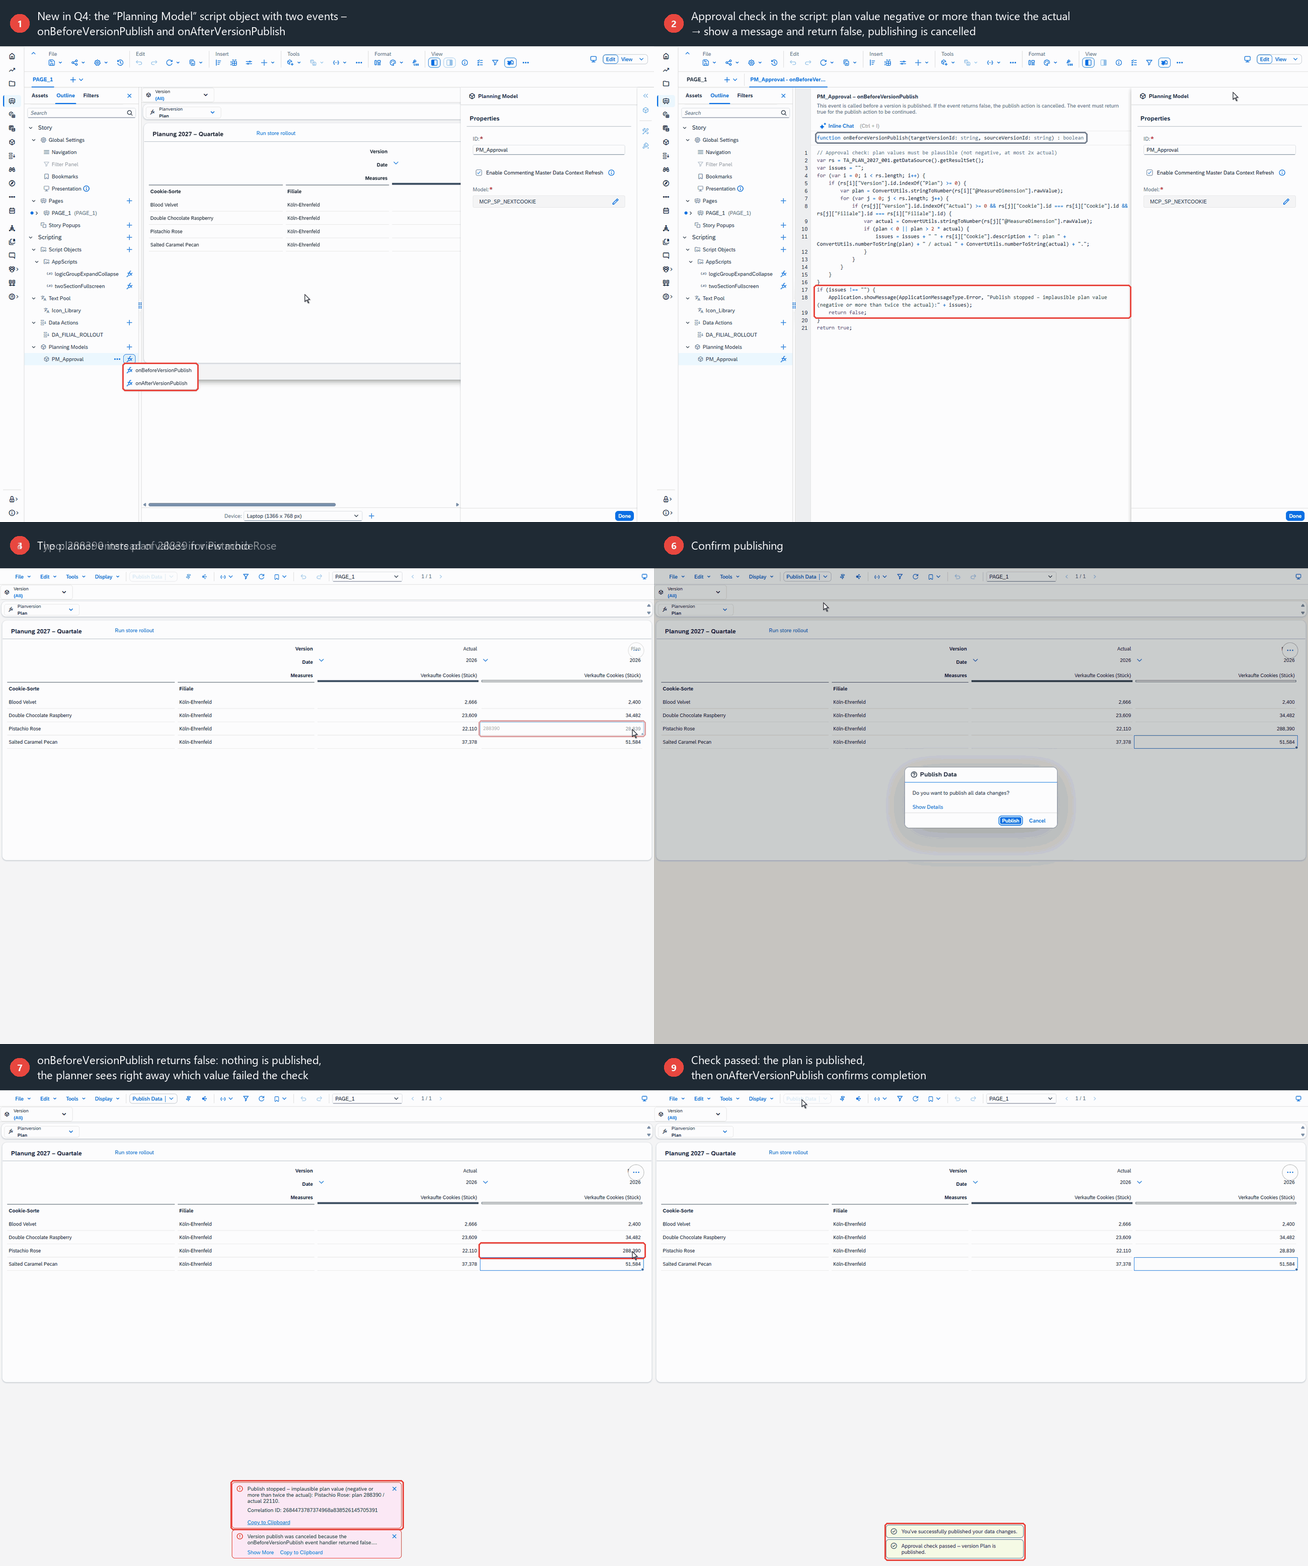 The new scripting events for publishing a version
Modeling and Data Integration
SAP also introduces a few useful improvements to modeling and data integration. With the new Model Load Jobs, data can now be loaded incrementally, meaning only changed records need to be processed instead of reloading the entire dataset. Modelers also have more control over how facts without matching master data are handled.
Navigation gets easier, too. Users can now jump directly from Public Dimensions to the Job Monitor or open models in the Excel Add-in straight from the Modeler.
Charts: Smarter Waterfall Sorting and Cleaner Axes
Waterfall charts are getting a useful upgrade: You can finally sort the bars. Until now, their order was fixed by the data model. With the new sorting options in the quick menu, users can arrange contributions by size, making the biggest drivers and negative impacts immediately visible. In variance mode, it's also possible to sort by variance. There is one limitation for SAP BW users, though: Sorting doesn't work with BW secondary structures. Another welcome addition is support for Linked Analysis, meaning that selecting a value in a waterfall chart can now filter other widgets in the story.
Combination charts also become more flexible. When combining columns and lines, a line measure can now share the same axis as the columns. This makes sense when both measures use the same unit, for example, margin and its moving average. Previously, SAC automatically added a second axis, which could create a misleading impression of the differences between values.
And finally, axis titles can now be customized. Instead of automatically combining every measure name into one long, hard-to-read label, users can simply define a clear, meaningful title.
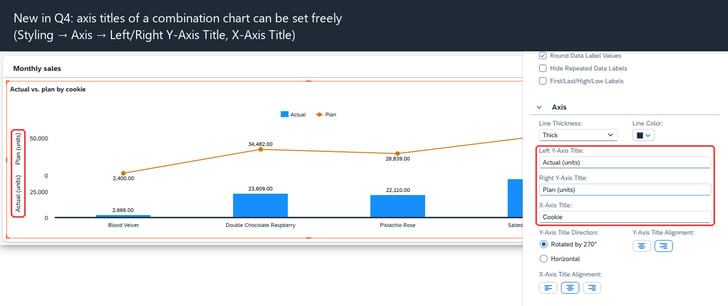 Custom axis titles in a combination chart
My Metrics: From Tracking KPIs to Active Monitoring
My Metrics is becoming more useful for everyday monitoring. Users can now create their own metrics directly by choosing a data source and measure, setting filters, and adding a variance or threshold. With thresholds in place, KPIs can be actively monitored instead of just tracked.
Report subscriptions have also become more flexible. Users can choose to receive all metrics from a list or only those that breach their thresholds. An AI-generated summary can highlight important changes and developments, with SAP recommending its use from the third report onward. This makes My Metrics a practical option for lightweight KPI monitoring.
SAC Compass: Easier Cleanup and More Simulation Options
Managing simulations in SAC Compass is getting easier. Simulation owners and users with the necessary deletion permissions can now remove all private scenarios within a simulation, even those belonging to other users. Anyone affected will receive a notification.
There's also more flexibility when simulating new drivers. For example, accounts without historical data can now be modeled using random sampling.
However, the Compass widget still has the same limitations we pointed out in Q3: It only displays public scenarios and supports a single target measure per widget.
Data Analyzer: Easier Analysis, More Export Options, and Better Comments
SAP has made several small but useful improvements to Data Analyzer. Users can now drag a dimension directly onto a data cell to swap and filter dimensions in a single step. Excel exports are more flexible, too, with the option to disable the attachment. And clicking a model name in the Info Panel now takes users straight to the corresponding model in the Modeler or Data Builder.
Comments are getting more useful as well. They can now be transferred to other periods or versions based on defined rules, making it easier to carry comments forward when rolling a plan into the next year. Comments can also be exported as CSV files. Other improvements include single selection in hierarchies for story and page filters and a redesigned variant selection dialog.
Live Data Access: Databricks and SharePoint Join the List
SAC is expanding its Live Data Access capabilities with two new sources: Databricks and SharePoint. Instead of importing data into SAC, modelers can now create live versions that access data directly from Databricks or from Excel tables and lists stored in SharePoint.
In planning models, this data can be used as actuals, included in Data Actions, or copied into planning versions. Writing changes back to the original source isn't possible, though.
SharePoint could be particularly useful for business teams that still maintain their data in Excel and regularly upload it to SAC. There's one important limitation: Data Wrangler isn't available for live connections, so the data needs to be properly structured at the source. And as anyone who has worked with Excel files that have grown over the years knows, that's not always the case.
There are also a few technical requirements. SAC must run on SAP HANA Cloud, and Live Data Access needs to be activated by SAP through a support ticket. SharePoint connections additionally require the Data Access Agent.
The approach is similar to the Snowflake live connection, which we've already explored in detail in a dedicated blog post.
SAP Analytics Cloud QRC4 2026: Our Conclusion
Like Q3, the Q4 release is all about small but meaningful steps forward. Some improvements will make everyday work easier right away, while others still need to prove their value in practice.
The new string functions in Advanced Formulas are a welcome addition, although we would have liked to see them much sooner. After all, AI agents are already quite capable of helping generate scripts, as long as they know the right syntax. When it comes to AI, the real highlight for us is the Prompt Insights Widget. Its new Scripting API gives story developers much greater control over how AI is used in stories. We're still waiting for the promised AI agents, but there's already plenty of potential for practical applications. Of course, getting meaningful results starts with a solid data foundation. Clearly named models and well-maintained synonyms are essential, especially for Just Ask and Joule.
Seamless Planning is also moving forward, bringing SAC and Datasphere closer together. The version dimension and new Task Chain operator could open up interesting opportunities for companies looking to combine actuals and planning data in Datasphere or integrate external forecasting models. We're looking forward to seeing how well these features perform in practice.
All in all, Q4 is a solid release rather than a game changer. Not every new feature will stand out in daily use, but planners and story developers are getting several useful tools that can make their everyday work easier.
Are you planning the switch to the new Table Build Experience or want to put the planning features from SAP Analytics Cloud QRC4 to work in your SAC? Get in touch with us, we will be glad to support you.