



















At the beginning of the year, AI in SAP Analytics Cloud was still a fairly modest affair. There were a few marginal features, and most of them sat behind a token paywall in the form of AI Units. Joule did exist, but mostly outside of SAC. You could ask Joule questions about SAC models, but inside SAC itself Joule neither built a story nor quickly rearranged a few charts in an existing one. SAP was working on bringing Joule properly into SAC, and anyone looking for alternatives really only found one freely available MCP server from the community, which could read content and export data. A useful addition to SAC in general, but not a big step forward for dashboarding.
Fast forward to October 2026. At the DSAG annual congress, SAP announced that AI-assisted Story Generation is coming with QRC4 2026: entire dashboards are to be created from a data model, context and a prompt. The feature was already shown as a private preview at Sapphire in May. Sounds good at first. After the conversations at the congress, however, we were left somewhat disillusioned, and that turned out to be justified: Story Generation does not appear in the What’s New for QRC4. On the roadmap, it is now listed under a new name as “Data and Analytics Insights Agent”, still planned for Q4 2026. So we asked ourselves internally whether Claude could do this at least as well.
We wanted to find out and built our own SAC MCP server. To be fair, most of it was built by Claude. We mostly played product owner: ideas, questions and a lot of “can we do that differently?”
The first commit went out on a Saturday evening shortly before midnight, and after one weekend there was already a prototype that builds entire dashboards from a single prompt. In the weeks that followed, it grew into a full-fledged MCP server.
What is an MCP server and how does it connect Claude to SAP Analytics Cloud?
MCP stands for Model Context Protocol, an open standard that lets large language models (LLMs) such as Claude talk to other systems. Essentially, an MCP server is an adapter. It describes which tools a system offers, for example “create story”, “add chart” or “set theme”, and the LLM decides on its own when to use which tool. A prompt like “Build me a sales dashboard with three KPIs and a table by region” thus turns into a sequence of real actions in SAC.
Our SAC MCP - from blueprint to toolbox
As our first blueprint we used the SAC MCP server by JumenEngels, the community server mentioned above that covers the official SAC REST API. On top of it, we added our own layer that uses the same internal interfaces as the SAC user interface itself. By now our server has around 180 tools. Alongside this blog post, we have published it as open source under the MIT license on GitHub: sac-workbench-mcp. After the BW Modeling MCP Server, it is our second open source server.
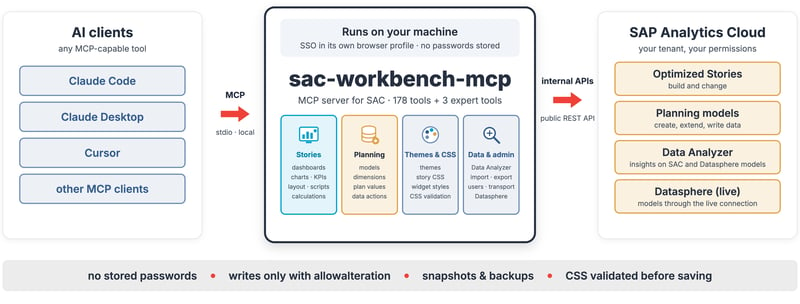
When building stories, the LLM creates the story, connects the data model, places KPIs, charts, tables and filters, and sets the theme and template. Changes after the fact are no problem either, such as switching a chart type, assigning colors per version or adding a calculated measure. To make sure nothing breaks, the server checks every piece of CSS before saving against the list of all classes accepted by the SAC CSS editor.
How Claude builds an SAC story from a single prompt
The following video shows how a complete dashboard is created from a single prompt. Theme and template are defined beforehand, Claude takes care of the rest. The whole thing takes less than two and a half minutes. To keep it from getting boring, the video is of course sped up a little.
Get our presentation "Agentic Development with SAP BW"

Case example: how Claude built a complete SAC dashboard, data model and theme
Built by a ghostly hand
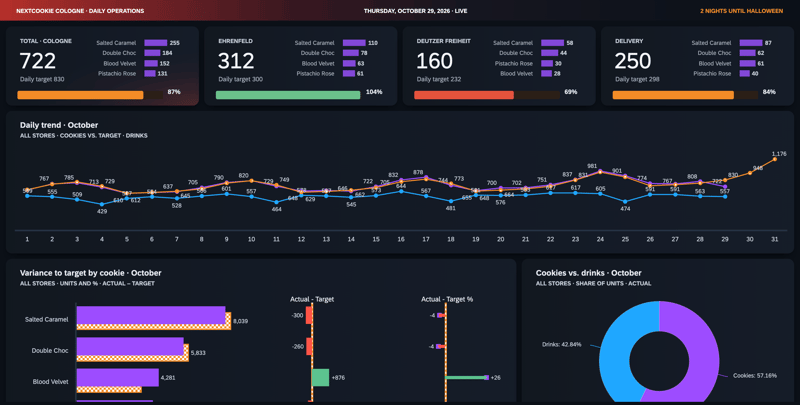
In our last blog post we presented the dark mode dashboard of the fictional Cologne bakery NextCookie Cologne and hinted at the end that the story, data model and theme were built by a ghostly hand. That ghostly hand was Claude, and it built the story as well as everything behind it:
-
Data model - stores, delivery service, products, date and version with the measures for cookies and drinks.
-
Actual data - fictional sales figures for October, generated day by day and loaded via the import API.
-
Plan data - daily targets per store and cookie up to October 31, including the Halloween peak.
-
Refining the model - a category hierarchy for cookies vs. drinks plus helper dimensions for day and calendar week. For this, the data was exported, extended by the new column, reloaded and reconciled against the totals.
-
Theme - NL_DARK with around 400 CSS rules for cards, glow effects and hover states.
-
Story - KPI tiles, charts, toggles via scripting and breakpoints for tablet and smartphone.
The idea, the design rules and many rounds of feedback came from us. Claude built all of it with our MCP server.
How well does AI dashboard generation in SAP Analytics Cloud work in practice?
Is it perfect? No.
Can it control SAC end to end? Yes.
Does it build perfect dashboards? No, at least not quite.
Let Claude or any other LLM loose without guidelines and you quickly end up with AI slop: technically correct, but with too many charts, wildly mixed colors and a layout hardly anyone would build. With a clean theme, a good template and a few clear design rules, such as how many KPIs belong in the top row or which chart types are allowed, it quickly turns into usable dashboards. The server already comes with basic guidelines for a clean standard dashboard. Good design, however, cannot be shipped as a one-size-fits-all solution, because every company has its own corporate design, its own KPIs and its own reading habits. To create truly attractive and logically structured dashboards, you need experienced developers and designers who extend the LLM with suitable design rules and skills. For NextCookie, we used our own, and that is exactly where we come in as consultants.
In the end, the classic 80/20 rule applies: the LLM takes over around 80 percent of the work. Special cases, extra requests and the famous bells and whistles still need to be polished by hand or with targeted prompts, often because they simply cannot be explained in a single prompt.
For NextCookie, we actually counted: of around 1,800 calls into SAC, only a good third went through ready-made MCP tools. The rest were clicks in the builder, custom JavaScript and screenshots, mostly for configuring charts. That is exactly where new tools came from, and it is how we have worked ever since: every story shows us where Claude still takes detours or where we had to fix things by hand, and that is where we develop the server further.
To make sure the LLM doesn’t cause any trouble in SAC, the server comes with clear guardrails. Every change has to be explicitly approved, and if needed, the server can run in read-only mode. Before larger changes to a story, a snapshot is created, data is backed up before it is reloaded, and plan values that have been written are initially visible only to the user until they publish them. The server runs locally with your own SSO login and does not store any passwords. In other words, the LLM can do exactly what the logged-in user is allowed to do, and nothing more.
For many functions, the server uses the same internal interfaces as the SAC user interface itself, not just the officially documented API. That is exactly what makes it so powerful, because only this way can stories, themes and planning models really be built. It also means, however, that a quarterly update can change individual tools. For this, there is a smoke test that shows after every update what needs to be adjusted. The server is an open source project that we develop and maintain at NextLytics. It is neither a commercial product nor an official SAP MCP server, and anyone can use it freely.
Joule vs. Claude via MCP: how do the two approaches to AI in SAC compare
We have not been able to test AI-assisted Story Generation ourselves yet, but the approaches can be compared. Joule is SAP’s assistant, built directly into SAC, running on the model SAP provides for it and tied to SAP’s licensing and AI Unit logic. Our MCP server works from the outside, with the LLM of your choice, and besides building stories also covers themes, CSS, scripting and planning.
SAP has already taken first steps toward MCP: at TechEd 2025 it announced MCP support for several products, and in SAP HANA Cloud it is already available. Joule Studio now has its own MCP builder, and at Sapphire 2026 SAP announced its partnership with Anthropic to bring Claude to the SAP Business AI platform. There is still no official MCP server for SAC, though.
Controlling SAP Analytics Cloud with Claude: Our Conclusion
Joule who?
SAP can keep expanding Joule, and once Story Generation arrives, it will certainly be an exciting feature for SAC. In the long run, however, SAP will not be able to close itself off from MCP and the free choice of LLM. To put it a little bluntly: while SAP is still preparing its Story Generation, Claude is already building stories in SAC.
Apple writes on its devices “Designed by Apple in California. Assembled in China.” So will our SAC stories soon read “Designed by NextLytics, made by Claude”?
We are curious to see how SAP’s AI-assisted Story Generation holds up in a direct comparison.
In the coming weeks, part two will look at what our SAC MCP can do beyond stories - from planning and data models to administration. If you don’t want to wait that long, you can find the server on GitHub right now.
Do you have questions about SAP Analytics Cloud or would you like to try AI-supported dashboarding yourself? Just get in touch with us - we look forward to hearing from you!