/Logo%202023%20final%20dunkelgrau.png?width=221&height=97&name=Logo%202023%20final%20dunkelgrau.png)






















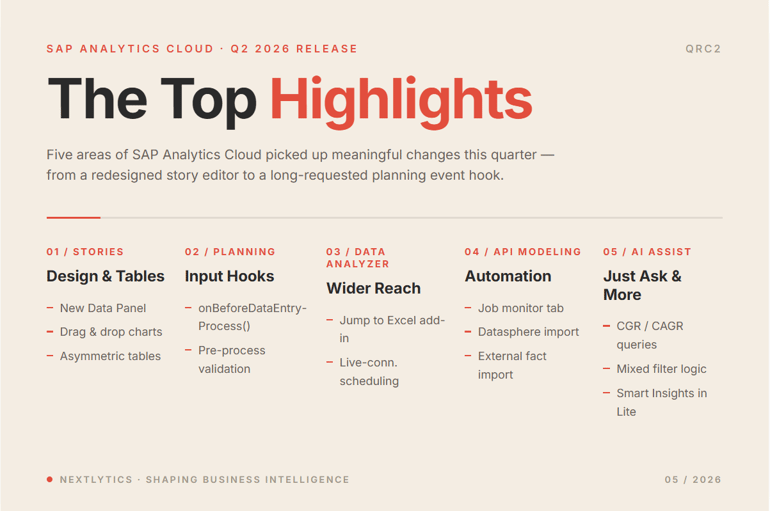
Another quarter, another SAP Analytics Cloud (SAC) release, and this one packs a few changes worth knowing about, picking up where we left off in our Q1 2026 release blog earlier this year. The Q2 2026 update (2026 QRC2, in SAP's release codes) started rolling out mid-May, and the difference is clear after a few weeks with it. It actually changes how a few things work: the story editor gets a redesigned right-side panel, the new table build experience finally supports asymmetric layouts, and SAC Planning picks up a long-requested event hook that fires before user input is processed.
Beyond those three, the release touches most other areas of the product: a couple of Data Analyzer improvements, API enhancements that close real gaps for automated data flows, and another round of Just Ask refinements that make natural-language queries genuinely more useful. The features we work through below are the ones we think will land most quickly in real projects.
SAC Stories
Use the New Data Panel
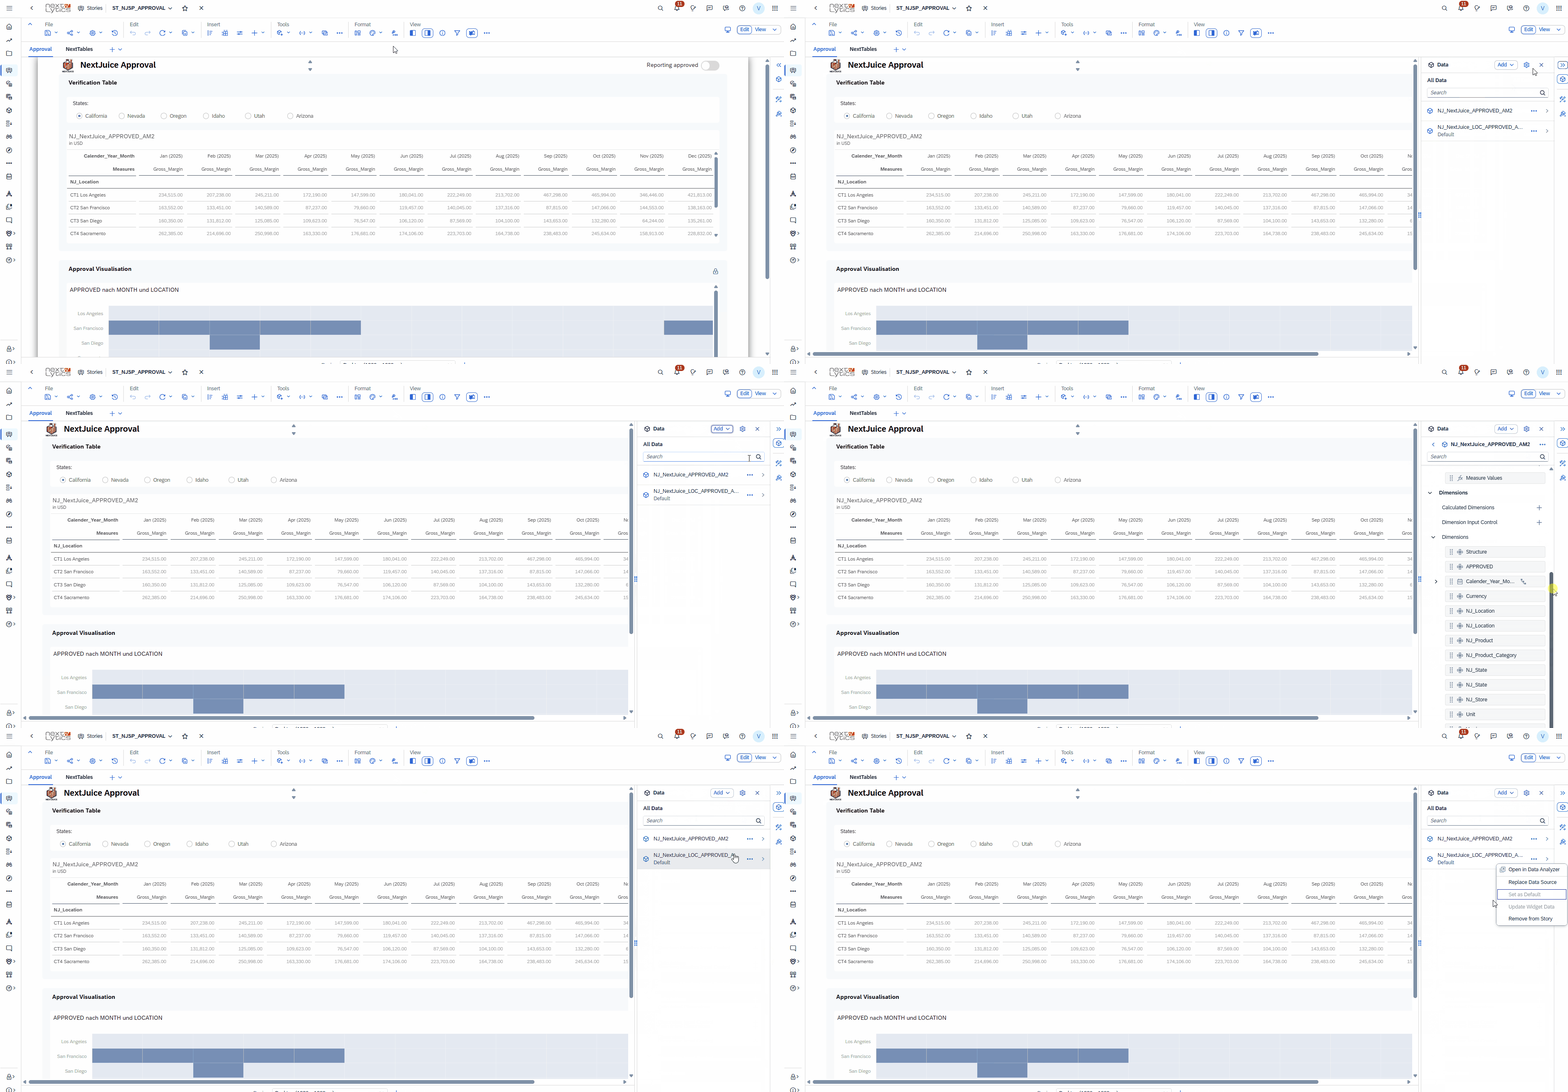
Open a story in edit mode after the Q2 update and the first thing you'll notice is on the right side: the Available Objects panel is gone, replaced by the new Data Panel. It takes over what Available Objects used to do and folds in the Add New Data action that previously lived in the story toolbar, so a story's data setup now happens in one place instead of two.
For developers, this is the bigger of the two changes. The old workflow had you switching between two surfaces just to wire up a chart: one panel for "what's already in the story," a separate toolbar entry for "let's add another model." The new Data Panel pulls those together and adds a few smaller conveniences on top:
-
search across every object across every model attached to the story
-
update a widget's data source from inside the panel
-
open a model in the Modeler with one click
-
launch a Data Analyzer Insight directly from a model
Why it matters: For teams maintaining stories with multiple models (which is most enterprise scenarios), this is a real reduction in clicks and a cleaner mental model of where the data in a story actually lives.
Drag and Drop Available Objects to Build Charts
The companion change is drag-and-drop chart building in the Optimized Design Experience. From the Available Objects area of the new Data Panel, you can now grab a dimension or measure and drop it straight onto the canvas, instead of right-clicking through menus or hunting in the builder panel for the right axis.
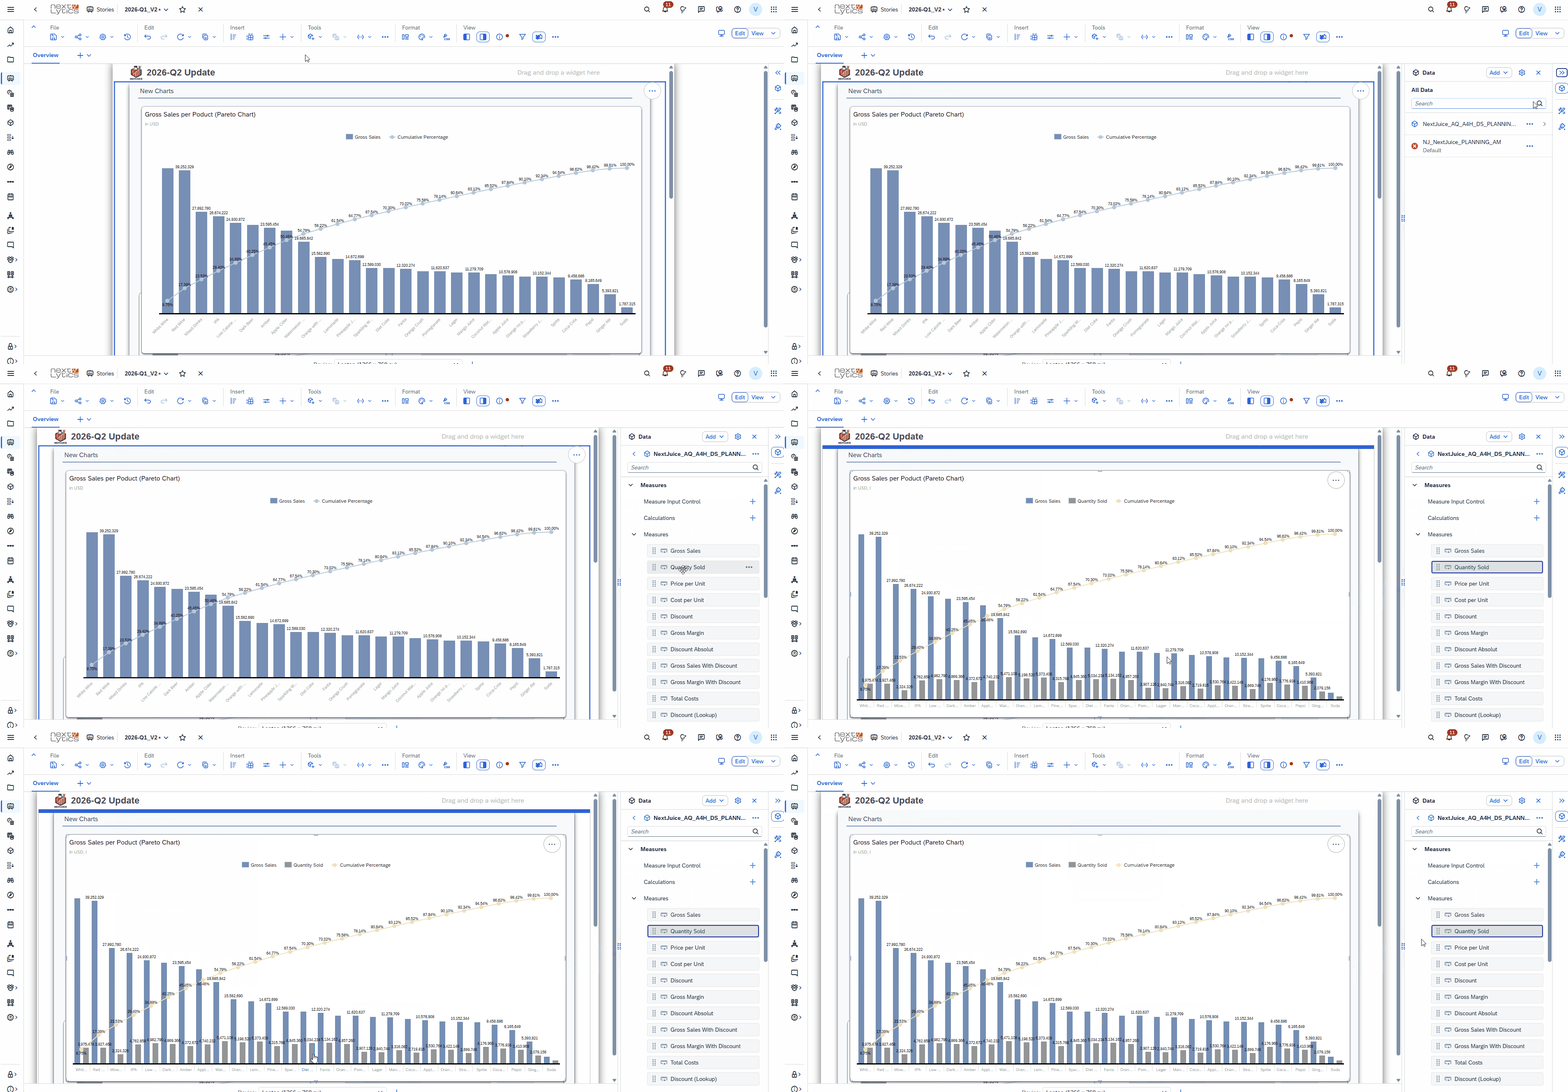
It's a small thing on paper, but it's one of those changes that aligns SAC with how people instinctively expect to work in a modern BI tool.
Dashboarding with SAP Analytics Cloud - Download the whitepaper here!
New Table Build Experience
1.Data Visibility in Tables ()
The headline change of this release: real table flexibility. The new table build experience now supports data visibility controls, which means you can build asymmetric tables natively with no scripting, no modeling workarounds, and no restructuring just to get the layout right.
Here's how it works. For any structure on a table (Account, Measures, or Structure / Cross Calculations), you can apply a visibility filter to individual members and decide which inner hierarchy levels are visible, plus whether Totals appear. The moment you start filtering structure members individually, the table axis becomes asymmetric: different measure layouts per account, for example, or different cross-calculations per scenario. The classic "I want actuals + budget + variance for revenue, but only actuals for headcount" pattern that used to need workarounds is now first-class behaviour.
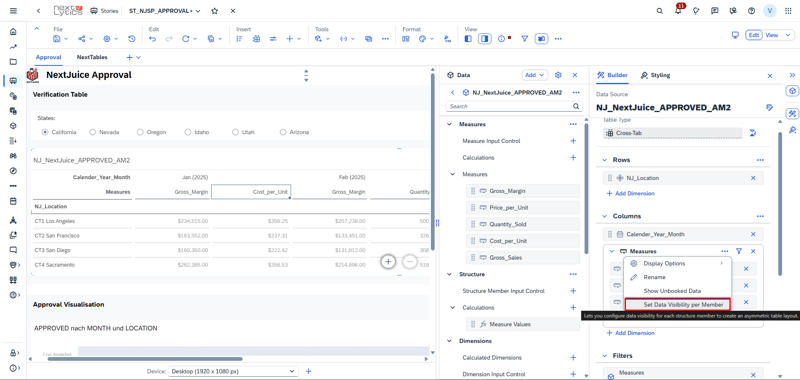
For other hierarchical dimensions (everything except Account), the same visibility filters apply, but the table stays symmetric, hiding a hierarchy level or Totals applies uniformly across all row or column combinations. That gives you a clean way to control table depth without losing consistency.
This one deserves more space than a release recap can give it, so we'll follow up with a dedicated blog post walking through real asymmetric table scenarios end-to-end. For now, the takeaway: a modeling compromise that has shaped how SAC tables get built for years just got considerably smaller.
2. Automatic Switch to New Table Build Experience
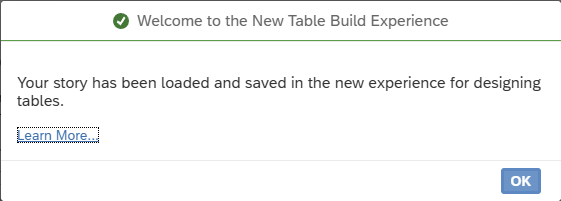
To smooth the path to the new table build experience, SAC now actively nudges you toward it. When you open an optimized story with tables in edit mode, the system prompts you to switch and it's a single click.
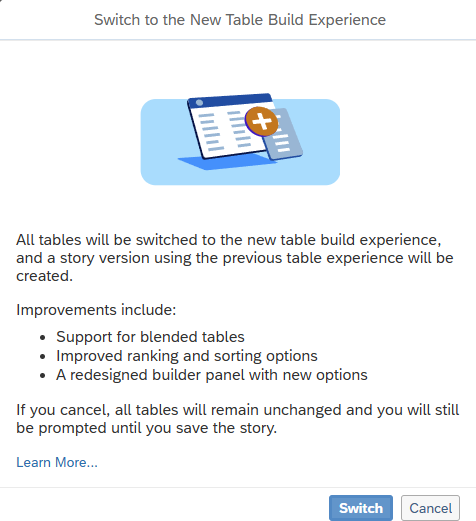
Two practical points worth knowing:
- You can cancel the prompt and keep working in the previous experience for that session.
-
When you do switch, SAC automatically creates a story file version using the previous table build experience as a backup. (File Versions were introduced in Q1 2026, and this is exactly the kind of guarded migration they were designed for.)
3. Show Totals on Blended Data
A smaller but practical addition closes out the Stories changes: you can now enable Show Totals on blended charts and blended tables. Until now, blending data from multiple models came with the side effect of losing totals, a recurring frustration that pushed some teams back to single-model designs or to building a unified model just to keep a totals row. With Q2 2026, that workaround disappears.
It's worth pairing this with the new table build experience, where totals behaviour is now also controlled per structure member through the data visibility settings discussed above.
SAC Planning
New onBeforeDataEntryProcess() Table Event
Planning teams know the pain of validating user input after the fact: a planner enters values, SAC processes them, and only then do you find out that something violated a business rule, broke a referential constraint, or pushed a hierarchy out of balance. The cleanup is annoying. The hit to user trust is worse.
Q2 2026 introduces a new table event, onBeforeDataEntryProcess(), that closes that gap. As the name suggests, it fires before SAC processes any data change, and it catches every input path you'd want it to , single-cell input, mass entry, fluid data entry, copy and paste operations, and value distribution. That's a deliberately complete list, because most previous validation workarounds missed at least one of those channels and had to be patched together to cover the rest.
.png?width=800&height=380&name=06.onBeforeDataEntryProcess().png)
.png?width=1899&height=317&name=06b.onBeforeDataEntryProcess().png)
In practice, this means you can centralize input validation, allocation guards, and warning messages in a single hook that runs before any user-entered value reaches the model.
Why it matters: Blocking entries that would exceed a contract cap, flagging negative inputs in a measure that should stay positive, or routing a confirmation prompt before a large value-distribution operation lands. It's the kind of foundational hook that planning developers have been asking for over several releases, and we expect it to quietly become a standard piece of well-built SAC Planning applications over the next few quarters.
API Modeling Enhancements
API-level work doesn't usually steal the spotlight in a release blog, but Q2 ships three coordinated improvements worth a quick mention. Together, they fill three gaps that have been showing up in automated data flows for a while.
The most visible change is on the monitoring side: the SAC job monitor now has a dedicated Data Export API tab, where you can check the status of delta extraction and delta calculation jobs alongside everything else you already monitor. For anyone running the Data Export Service in production, it replaces the old habit of piecing together job status from logs.
The other two improvements both extend the Data Import Service API:
- Master data into Datasphere public dimensions. Master data can now be imported directly into public dimensions stored in SAP Datasphere — useful when Datasphere is the system of record for master data and SAC needs to consume it without re-keying.
- External fact data into seamless planning models. Fact data coming from third-party sources (anything that isn't SAC or Datasphere (like Snowflake) can now be imported into an existing private version of a seamless planning model. That's a clean path for planning teams who need to pull operational data from outside the SAP estate for what-if analysis, without disturbing the public version everyone else relies on.
Taken together, these aren't features you'll demo to executives. But they're exactly the kind of plumbing that decides whether automated SAC workflows feel reliable in production or fragile around the edges.
AI for Planning & Analytics
Just Ask
Just Ask, SAC's natural-language query interface, picks up a noticeable batch of refinements this quarter. None is a headline change on its own, but together they meaningfully expand what users can ask without help from a developer.
Percentage contribution. Just Ask can now resolve proportional-share questions natively. Queries like "How much does California contribute to total USA sales?" or "What percentage of total sales comes from Food and Drink?" return a contribution chart directly, without needing a calculated measure on the model side. Useful for the everyday business question that previously needed a workaround.
.png?width=800&height=277&name=07.Just%20Ask%20User%20Interface%20Improvements(percentage%25).png)
Compound growth rate (CGR / CAGR). The natural language parser now recognises CGR and CAGR intent across multiple time granularities and renders the result as a chart. "Show me the compound growth rate of sales from 2024 to 2025", "What is the CAGR between 2024 and 2025", and "Quarterly CGR of expenses from Q1 to Q2" all work without any formula setup. Useful for the routine growth-rate questions that previously needed modeler involvement.
Mixed advanced filters. A subtler but important fix. Date-bound queries that combined a range with an exclusion (e.g. "taxes by product for 2013–2017 excluding Q3 2015") used to silently discard the exclusion and return inaccurate results. Q2 preserves the exclusion as an SAC Advanced Filter on the chart, which is also carried forward when the chart is copied into a Story.
Just Ask: shortcut to the model editor
A new shortcut button has been added to the Just Ask model details page in Manage Models ,one click takes you to the model in its respective tool (the SAC Modeler or the SAP Datasphere Data Builder, depending on the model type). For developers iterating on a model and its Just Ask configuration in parallel, this removes one of those small frictions that quietly adds up.
Smart Insights
Smart Insights: automatic progressive loading for Top Contributors. Smart Insights is SAC's AI-driven explanation layer ,click a data point and the system surfaces the dimensions and members that explain its value. The Top Contributors calculation behind that explanation can be expensive on large models, which is where Q2's change matters. For Datasphere and Seamless Planning models, progressive loading of Top Contributors now kicks in automatically whenever a query crosses 20 dimensions or hierarchy levels, with no setting for admins to toggle. The practical impact is responsiveness: insights start surfacing while the rest of the computation continues in the background, which is the difference between Smart Insights feeling fast on big models and feeling sluggish. (One caveat carries over: Top Contributors still doesn't apply to non-additive measures like ratios or exception aggregations, since contribution arithmetic doesn't make sense there.)
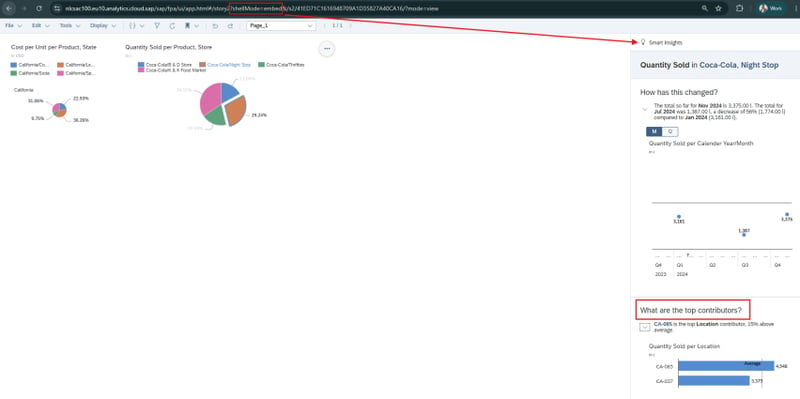
Smart Insights in Lite Viewer. Lite Viewer is SAC's lightweight story viewer. The second Quarter update adds Smart Insights to the feature list. That's a meaningful addition because Smart Insights is exactly the feature this audience tends to want: a one-click "what's driving this number?" explanation, without digging into the underlying data.
Why it matters: Consumers can now get the Smart Insights explanation , without giving up Lite Viewer's faster load times or simpler interface.
Data Analyzer
Two smaller-but-useful additions land in Data Analyzer this quarter. Jump to the Excel Add-in for further analysis. From within Data Analyzer, you can now hand the current analysis off to the SAC add-in for Microsoft Excel. The path is Export → Open in Microsoft Add-In; SAC downloads an Excel workbook that mirrors your current navigation state, and once you log in to SAC from inside Excel, the data is sitting in the same drilldown you left. For users who hit the limits of Data Analyzer's exploration features, this is the obvious next step rather than rebuilding the analysis from scratch in Excel. One technical note: for remote connections like SAP BW or SAP HANA, this feature only supports tunnel connections.
Scheduling Data Analyzer Insights on Datasphere Live Connections. Q1 2026 brought scheduling to stories on Datasphere live connections; Q2 extends the same capability to Data Analyzer Insights. Two prerequisites apply: an SAP Datasphere tunnel connection must exist in SAC, and the Insight has to be based on that tunnel connection; direct connections won't work for scheduling.
Why it matters: For organisations following a "data stays in Datasphere" strategy, this removes one more reason to fall back to imports purely for distribution.
SAC 2026 Q2 Release: Our Conclusion
Q2 follows the steady rhythm of recent SAC releases: a wave of focused improvements rather than a single tentpole feature, spread evenly across stories, planning, Data Analyzer, the API surface, and the AI layer. The cumulative effect is bigger than any individual change in isolation. Story development is meaningfully smoother, planning picks up a long-requested validation hook, the API plumbing keeps getting more complete, and Just Ask and Smart Insights both quietly inch toward day-to-day usability.
Three picks that will be felt most quickly in real projects:
- Data Visibility in the new table build experience - asymmetric tables natively, no scripting. This is genuinely new ground, and it removes a modeling compromise that has shaped finance-focused SAC implementations for years. A dedicated deep-dive blog will follow.
- The
onBeforeDataEntryProcess()table event - for any planning team that has chased after-the-fact validation, this is the architectural hook that finally makes input guarding clean. - Drag-and-drop chart building in the Optimized Design Experience - the smallest of the three on paper, but the one anyone building stories will notice on day one.
Do you have questions about this or other topics? Are you trying to build up the necessary know-how in your department or do you need support with a specific question? We are happy to help you. Request a non-binding consulting offer today.